Environmental Engineering Reference
In-Depth Information
(a)
(b)
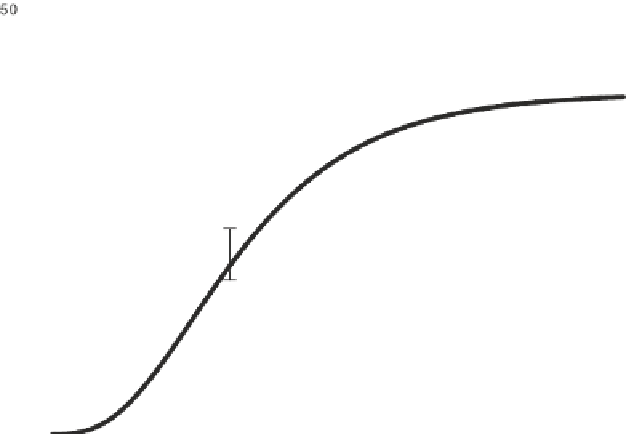
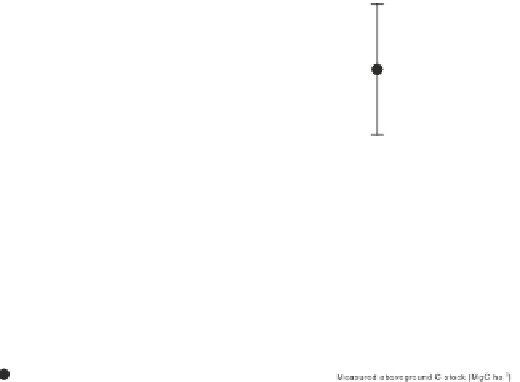
Fig. 13.2
Modeled aboveground carbon stock across the broadleaf plantation chronosequence (
a
)
and poplar chronosequence (
b
) as a function of stand age.
Dots
represent measured data,
continu-
ous line
represents modeled data.
Vertical bars
are standard errors. Correlation between modeled
and measured data is reported in the inserted panel with 95 % confidence intervals (broadleaf:
Y
=
0.99 X
+
0.026, R
2
=
0.97,
p
< 0.001, intercept is not significantly different from zero; poplar:
Y
=
0.96 X
+
2.73, R
2
=
0.99,
p
=
0.004, intercept is not significantly different from zero)