Environmental Engineering Reference
In-Depth Information
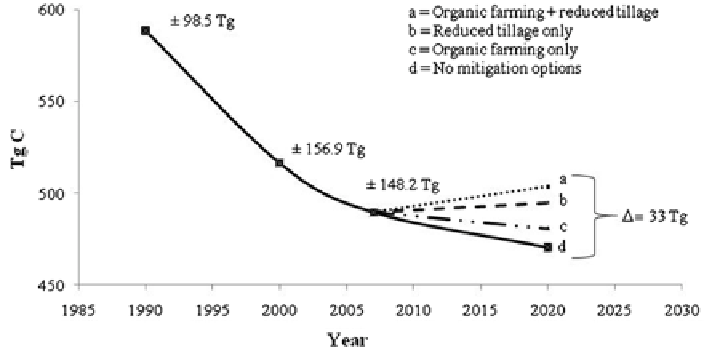
Fig. 8.3
Simulation of the impact of different mitigation options on the total SOC stock of the
whole cropland category from 2007 to 2020. Numbers indicates the standard deviation of the
SOC stock measured in the different years
between 20 and 30 cm, while about 10 % is ploughed to more than 40 cm.
Assuming a decrease of the ploughing depth to 20 cm for the 70 % of the
ploughed arable land area (2.43 Mha), and applying the corresponding C seques-
tration factor for reduced tillage, the amount of C sequestered in 2020 would be
10.4 Tg C, corresponding to 0.8 Tg C y
−
1
. Making a comparison with the 2007
SOC stock and considering that the other subcategories continue to lose C at the
same rate, the increase in 2020 for the whole cropland category is 5.2 Tg C
(Fig.
8.3
). The improvement of organic farming is another interesting option to
increase SOC stock in croplands. In fact, in Italy the area occupied by organic
farming represents only 5 % of the total agricultural surface. It is worth nothing
that, at European level, the size of organic farming soil is even less, about 2 %
of the total agricultural area (Rounsevell et al.
2002
), and Italy alone has 27 % of
European Union organic land (EC
2001
). A 2 % increase of the area occupied in
2007 by organic farming (0.5 Mha) is leading to an increase of about 0.8 Tg C y
−
1
until 2020, not enough to change the negative trend of the whole cropland cat-
egory. In fact, despite the similarity in the accumulation rate with reduced tillage
option, the loss of C from the other subcategories has to be considered, bringing
to an estimate for the total SOC stock in 2020 of 480.9 Tg C, 8.8 Tg C less than
the amount in 2007 (Fig.
8.3
). Combining the two mitigation options change the
negative trend of SOC from the cropland category, leading to a total SOC stock
in 2020 of 503.6 Tg C, 13.9 Tg C more than in 2007. More important, in 2020 the
increase resulting from combining reduced till age and organic farming mitigation
options will be about 33 Tg C more than the amount hypothesisable if no
mitigation options are planned, about 470.5 Tg C (Fig.
8.3
). All these hypothetical
increments indicate the difficulty in a sensible size increase of the cropland SOC
pool unless a national specific policy aimed to improve the agricultural practices is