Information Technology Reference
In-Depth Information
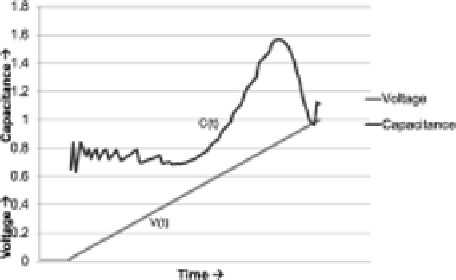
instantaneous capacitance at each voltage level of input slew, the plot is done across
different input slew. The graph shows input pin capacitance variation more than 2X. It
is a challenge to estimate one unique capacitance for Liberty file for a given cell.
To understand the behavior of input capacitance, we came up with new terms
called Capacitance range which is described in next section.
Fig. 2.
1.3
Capacitance Range
Capacitance range is the Capacitance calculated at different range of input slew. It
starts from mid-point of input slew for very small range ∆, (50-∆/2)% to (50+∆/2)%
and ends at the full range 0 to 100%. The Figure 4, shows input ramp(Aqua color),
Instantaneous Cap (light Black), and capacitance range(dotted curve).
Ideally, input pin capacitance should be constant across different range of input
slew, however, in reality, the cap changes with different range of input cap.
Fig. 3.