Information Technology Reference
In-Depth Information
Fig. 8.
Current from the external capacitor: from SPICE simulation of the circuit in Fig 7
Analog Simulation with LDO
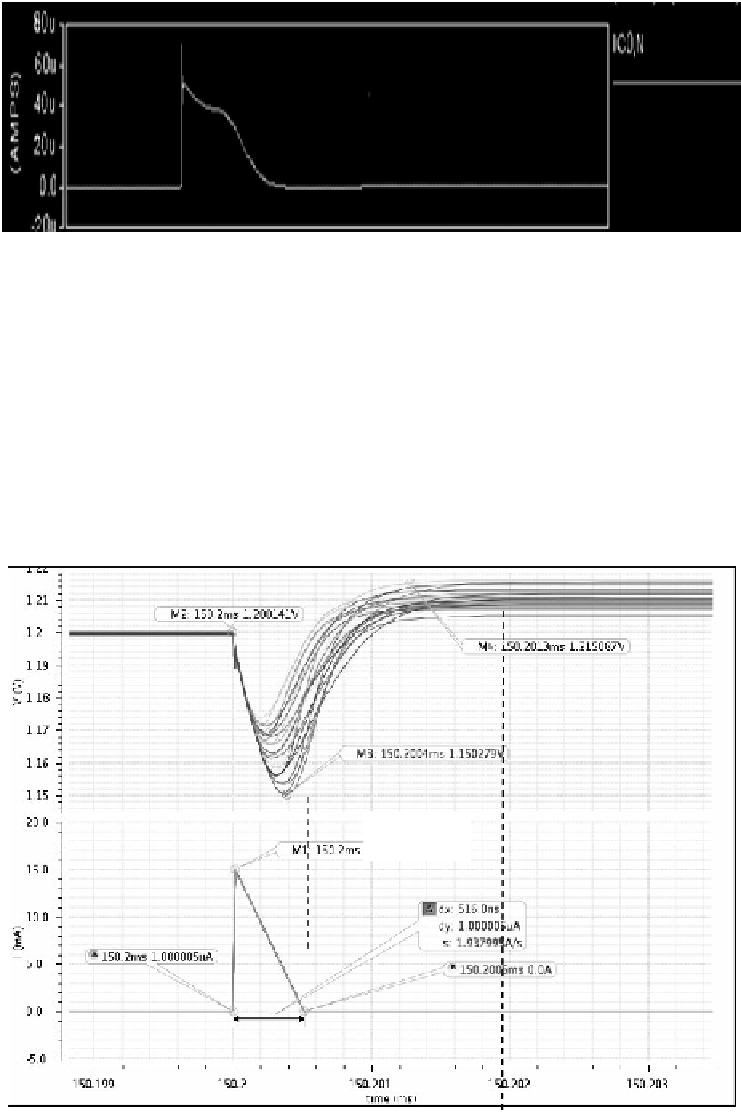
The analysis described so far showed the dip in the voltage at VDDC and the current
waveform, which is an important result. However it does not show the recovery back
to the original voltage supplied by the LDO. To do this we need to bring the LDO
back in the picture. The current waveform of Fig 8 is multiplied by a factor of NPS,
and then replaced by an approximate piecewise-linear (triangular) waveform shown in
the lower part of the figure below. This triangular waveform is then given as input
into an analog simulation of the LDO. The bottom-graph in Fig 9 (marked
I(ma
) ),
shows this triangular current waveform. The LDO has been simulated across process-
temperature corners, represented by different curves on the voltage graph in Fig 9.
~1us
Fig. 9.
Analog simulation of the LDO: The lower graph shows the current waveform applied,
while the upper graphs show output voltage variations at various process-temperature corners