Information Technology Reference
In-Depth Information
% NF Contribution in UWB LNA
M1
42%
M2
22%
M5
L1
other
5%
Lo
11%
M4
9%
M3
5%
L2
6%
n by UWB LNA components for entire range of 3.1-10.6 GHz
Fig. 2.
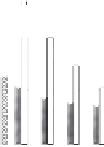
Noise contribution
16
Frequency (GHz)
Frequency (GHz)
14
12
10
8
6
4
2
0
f
f
1 .52 .53 .
.5 4 4.5 5 5.5 6 6.5 7 7.5 8 8.5 9 9.5 10 10.5 11 11.5 12
82 2.72 2.68 2.67 2.69 2.73 2.77 2.82 2.88 2.90 2.98 3.06 3.14 3.20 3.28 3.37 3.47 3.57
10 2.87 1.82 1.03 0.55 0.33 0.35 0.54 0.88 1.31 1.80 2.35 2.86 3.27 3.78 4.31 4.83 5.36
18 1.40 1.26 1.16 1.09 1.03 0.99 0.96 0.93 0.92 0.90 0.89 0.89 0.88 0.88 0.88 0.82 0.83
19 0.15 0.12 0.10 0.09 0.09 0.11 0.16 0.23 0.33 0.48 0.67 0.88 1.08 1.36 1.71 2.10 2.55
M1
5.47 5.18 4.16 3.39 3.01 2.8
M2
0.00 14.1 10.4 7.74 5.76 4.1
Ls
Lo
0.00 4.97 3.30 2.49 1.89 0.1
M3
0.00 0.00 0.42 0.30 0.23 0.1
Fig. 3.
Noise figure cont
tribution of UWB LNA major components at all frequencies
Fig. 4.
Prop
osed noise cancellation concept for UWB LNA


