Information Technology Reference
In-Depth Information
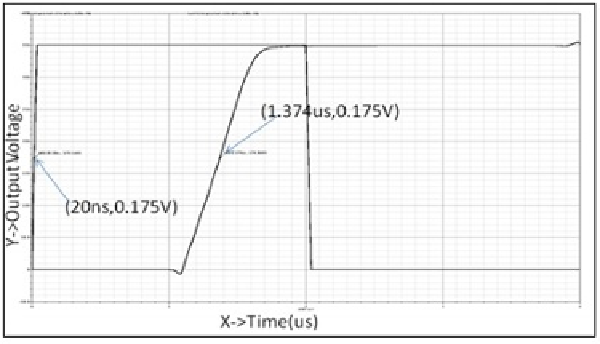
Simulation shows that there is slight variation in the delay from the sum 16th bit to
sum 31
st
bit but suddenly the delay increased from level 1 (sum1) to level 5 (from sum
16 to sum 31). Since, there was huge load on g0, p0 bit as it is used by other g
new
and
p
new
, the delay for the sum0 bit was maximum (approximately 900ns).The worst case
delay was coming out be 1.35us through Monte-Carlo simulation in UMC180nm is
also shown in fig.6.
Fig. 6.
Worst case delay of Kogge stone adder through Monte Carlo Simulation in UMC
180nm
Similarly, the analysis was done for the UMC90nm at different process corners, and
the worst case delay and the power dissipation is calculated. The transistor sizes taken
are L=85nm and W=120nm. Table 2 shows the simulated results for UMC90nm.
Table 2.
The Worst Case Delay and Power Dissipation of Kogge-Stone Adder at Different
Process Corners in UMC 90 nm
Power
Dissipation
(*10
-6
W)
Process
corners
Temperature
(
0
C)
Worst case
delay(ns)
Power-Delay-Product
(*10
-15
)
S.No.
1
TT
27
0.30
49.05
14.72
2
SS
100
0.25
114.55
28.64
3
FF
0
1.85
13.55
25.07
4
SNFP
27
0.46
70.85
32.59
5
FNSP
27
0.47
64.05
30.10