Graphics Reference
In-Depth Information
1.8
z
1.6
1.4
1.2
1.0
x
y
0.8
0.6
0.4
x
0.2
0.0
l
400
500
600
700
Wavelength,
l
5
(nm)
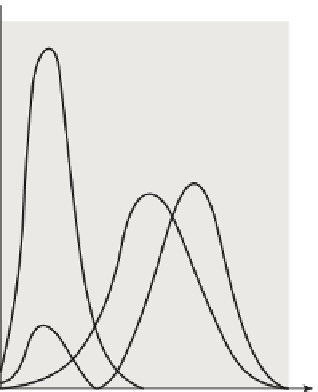
Figure 28.17: The color-matching functions x
,
y
,
and z for the 1931 CIE primaries.
• Because the red, green, and blue primaries can be identified as points in
XYZ
-space (i.e., as a linear combination of
X
,
Y
, and
Z
), any combination
of them can be so expressed as well; thus, there's a direct conversion from
XYZ
to
RGB
coefficients (and vice versa).
In analogy with the color-matching functions for red, green, and blue, a light
whose spectral power distribution is
P
can be expressed as
X
X
+
Y
Y
+
Z
Z
,
(28.17)
where
X
=
k
P
(
λ
)
x
(
λ
)
d
λ
,
(28.18)
Y
=
k
P
(
λ
)
y
(
λ
)
d
λ
, and
(28.19)
Z
=
k
P
(
λ
)
z
(
λ
)
d
λ
.
(28.20)
(More precisely: The light with power distribution
X
X
+
Y
Y
+
Z
Z
and the
light with power distribution
P
will evoke the same color response.)
In practice, such integrations are computed numerically, using the values of
the matching functions tabulated at 1 nm intervals that are found in texts such
as [WS82, BS81]. The constant
k
is 680 lmW
−
1
. But we also sometimes compute
the “colors” for the reflectance spectrum of some reflecting object. In this case,
one must choose a standard light source as a reference for “white” and illuminate
the surface. The values are usually scaled so that a completely reflective surface
has a
Y
-value of 100; thus,
100
W
(
k
=
,
(28.21)
λ
)
y
(
λ
)
d
λ