Graphics Reference
In-Depth Information
0.1
y
=
f
(
x
)
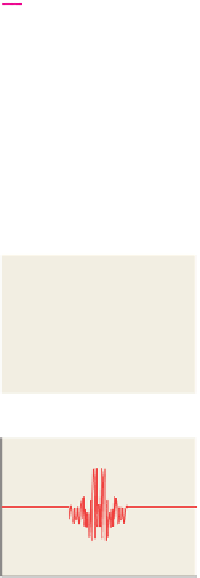
We've defined two kinds of Fourier transform, and have observed that they are lin-
ear, continuous, and length-preserving, and satisfy the multiplication-convolution
theorem. We can think of the Fourier transform as taking a “value representation”
of a function
f
(i.e., the usual representation, where
f
(
x
)
is the value of
f
at the
location
x
) into a “frequency representation,” where
0
−
0.1
−
100
0
100
F
(
f
)(
ω
)
tells us “how much
2
f
looks like a sinusoid of frequency
.”
We'll now look at two applications of these ideas: band limiting and sampling.
ω
0
y
=
F
(
f
)(
)
−
2
−
0.5
0
0.5
We've said that a function
g
is band-limited at
ω
0
if
F
(
g
)(
ω
)=
0for
ω>ω
0
,
0.1
f
()
x
2
that is “if
g
contains only frequencies up to
ω
0
.” This is illustrated schematically
in Figures 18.51 and 18.52. For the remainder of this section, we'll fix
y
=
g
(
x
)
=
ω
0
so that
0
“band-limited” means “band-limited at
ω
0
.”
Now we'll consider a similar computation on the interval
H
. Before we do
so, we need one further fact: Just as the Fourier transform of a box was a sinc
function, the inverse transform of a box is
also
a sinc function, as you can check
by writing out the integrals.
Now suppose that
f
is a function in
L
2
(
H
)
. What band-limited function
g
is
closest
to
f
? We'll answer this using the Fourier transform. Figure 18.53 shows the
idea. In the top row we see
f
and its transform. It's mostly made up of frequencies
less than 30, so we've truncated the transform to show the interesting parts. If
we remove all the high frequencies (we've kept frequencies 17 and lower in this
example), we get the function in the lower right. Removing all those frequencies
amounts to multiplying by a
box
of width 34 (ranging from
−
0.1
−
100
0
100
2
0
y
=
F
(
g
)(
)
−
2
−
0.5
0
0.5
Figure 18.50: When we stretch
the graph of f on the x-axis,
the graph of
F(
f
)
(in magenta)
compresses
ω
=
−
17 to
ω
=
+
17), that is, the function
on
the
ω
-axis
and
stretches on the y-axis.
B
(
ω
)=
b
(
ω/
34
)
.
(18.74)
Since multiplication by a box in the frequency domain is the same as convolution
by a sinc in the value domain, the inverse transform of the lower-right signal,
shown at the lower left, can also be obtained by convolving the original signal
with an appropriately scaled sinc, namely
1
y
=
g
(
x
)
0
−
1
S
(
x
)=
sinc
(
34
x
)
.
(18.75)
−
100
0
100
Notice that the result is a far smoother signal,
g
.
The signal
g
appears quite similar to the original signal
f
.Itisinfactthe
band-limited signal that's
closest
to
f
. That's easy to see by looking on the right-
hand side of the figure. The Fourier transform is
distance preserving,
that is, the
distance between
f
and
g
is the distance between
f
=
=
y
F
(
g
)(
)
20
0
(
g
)
.Soto
find the band-limited function closest to
f
, we need only look for the
transform
that is closest to
f
, but is zero outside the band limit. The only freedom we have
in picking
g
is to adjust it between frequencies
F
(
f
)
and
g
=
F
−
20
−
0.5
0
0.5
17 and
+
17; by making it match
f
there, we make the difference of
f
and
g
as small as possible.
−
Figure
18.51:
A
band-limited
function
and
its
Fourier
transform.
Inline Exercise 18.7:
Write out this argument with integrals.