Geoscience Reference
In-Depth Information
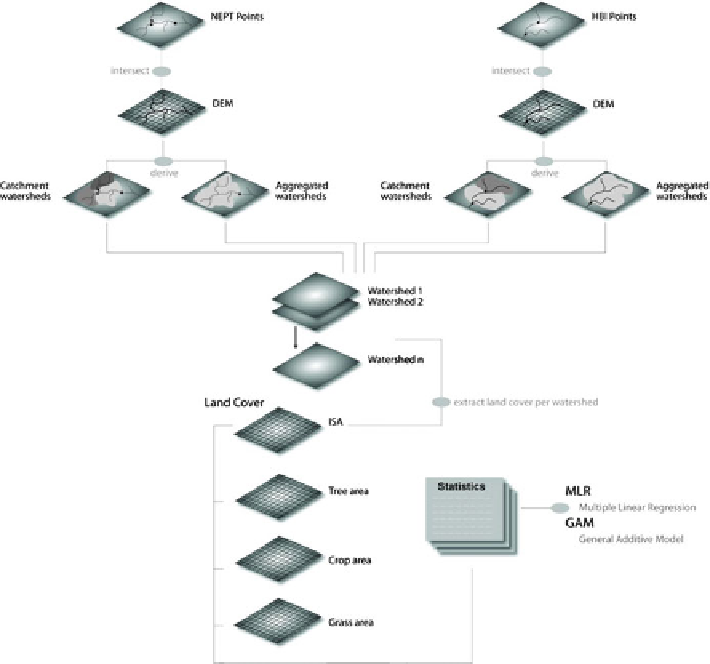
Fig. 4.2 A flow chart indicating the methodology used in comparing land cover metrics with
stream reach biological indices data for southern New England
4.4 Results
4.4.1 Land Cover Predictors of Stream Biota Metrics
The relationships between the land cover metrics and the biotic indicators is shown in
Fig.
4.3
. In general, the amount of impervious surface and tree cover had the strongest
correlation with the stream biotic metrics. These two metrics are inversely correlated
to one another. The relationship between percent imperviousness within a watershed
and nEPT produces an R
2
of 63 %, percent tree cover to nEPT, 41 % (p-value
0.001), while HBI to imperviousness produces an R
2
of 14 %, with percent tree cover,
34 % (p-value
0.001). The effectiveness of the landscape distance weighting was
not consistent in terms of improving model predictions, despite generally higher
simple correlations between the biotic indicators and land cover variables weighted