Geoscience Reference
In-Depth Information
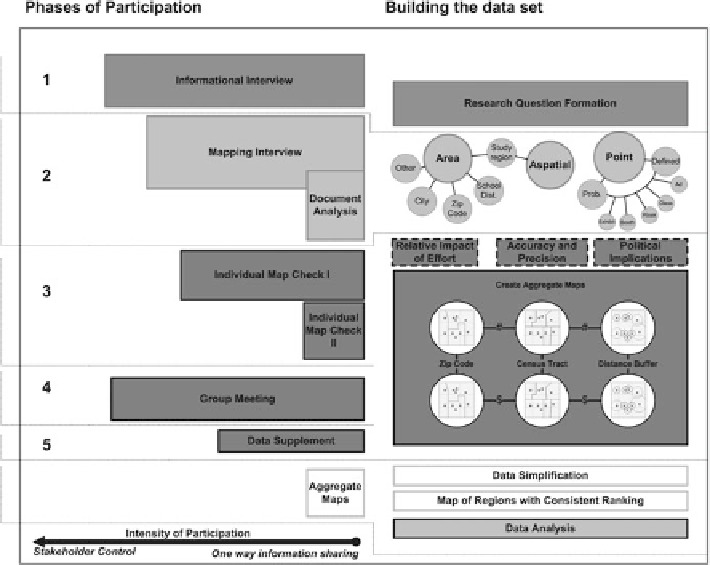
Fig. 3.3 Conceptual diagram of methods linking phases of participation on the
left
with the stage
of data development on the
right
. The length of the bar representing each phase of participation
corresponds to the intensity of participation while the width corresponds to the number of
organizations participating. Both
sides
of the diagram read chronologically from
top
to
bottom
with phases of participation
shaded
to match the corresponding step in building the data set
The ultimate goal of this research step was to produce a map of the cumulative
water information landscape. However, several tactical issues needed to be
addressed before this could happen: water information providers needed to verify
their information individually to assure some degree of accuracy, a method for
representing both point and area-based data needed to be discussed and agreed on
by all participants, and a method for including some measure of program quality
needed to be developed. The literature was consulted and several options were
created to accommodate the variable methods of data representation and program
quality. These are discusses in the section below. The reactions of stakeholders to
individual maps and alternative data representations are discussed.
3.6.1 Reconciling Points and Areas
In the first data collection phase, structured interviews were conducted with 29 of
the 39 organizations actively providing water information to residents living within