Geoscience Reference
In-Depth Information
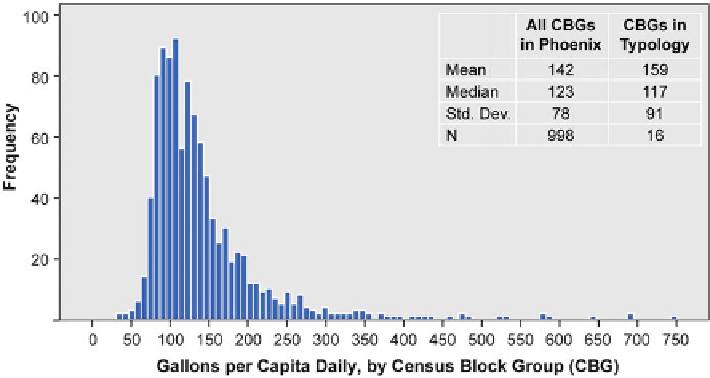
Fig. 2.1 Single-family residential water demand by Phoenix neighborhoods (Census Block
Groups, or CBGs)
consumption (Fig.
2.2
), which could hinder conservation initiatives. While half of
the neighborhoods underestimated their consumption, the other half held
perceptions that matched actual water demand rates. All of the high-use
neighborhoods fell under the perceptual categories of low or average water demand.
Although statistical analyses determined no significant correlations between per-
ceived and actual water-use rates as a whole, our integrated analysis and neighbor-
hood typology offer insights for enhancing the effectiveness of water conservation
efforts based on perceptions and other critical determinants of demand.
2.4.1 Socio-spatial Patterns of Water Demand and
Perceived Use
¼
Per capita water use rates across Phoenix census block groups (n
998) ranged
from 32 to 746 GPCD (see Figs.
2.1
and
2.2
), with a mean of 142 and stand-
ard deviation of 78. For the 16 neighborhoods in our typology, water demand
ranged from 65 to 353 GPCD, with a mean of 159 GPCD and standard deviation
of 89. Although these neighborhoods display a similar pattern of water use com-
pared to the broader region, the very low and high water-use areas are not
represented in our in-depth typology sample. Most notably, several neighborhoods
had extremely high (
350) GPCD rates that are worthy of further investigation.
Our focus herein, however, is the relationship between low to high water de-
mand and perceived rates of usage for diverse neighborhoods in Phoenix. When
>