Geoscience Reference
In-Depth Information
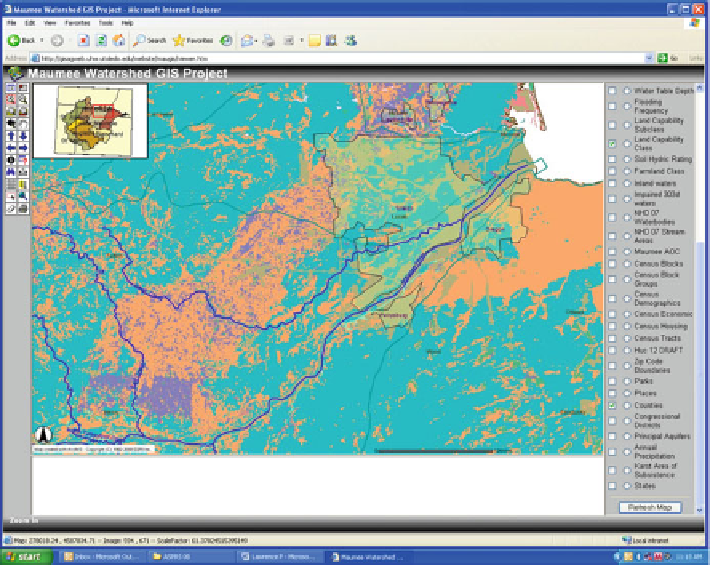
Fig. 8.4 Screenshot of Maumee GIS ArcIMS product as viewing one river basin and highlighting
the land capability classification layer
A land use and land cover layer was created for this study. Throughout the
creation of the classified map, ERDAS IMAGINE 9.1 was utilized unless otherwise
noted. Ground truth points were collected at selected transits along roadways within
the watershed resulting in over 300 points annually for analysis. Landsat TM images
of path 20/row 31 were used for the classification which were downloaded from
the OhioView website. Clouds and shadows in the images were removed by visual
assessment. Removal of the urban area was also conducted by visual assessment
using an urban area shapefile downloaded from the ESRI Census Watch website
(
http://www.esri.com/censuswatch
). The images were then stacked to perform the
multi-temporal classification. For example in 2005 images were used from May 4th,
August 8th, and November 12th in order to cover the complete growing season for the
primary crops: corn, soybeans and wheat.
The identification of crop types within farm fields was also checked by USDA
personnel at the county level within the watershed on an annual basis via “wind-
shield surveys” that would generate 8,775 observation points. Among these crop
type observations, 78% were either corn or soybean. At total of 150 points per class
for the entire Maumee watershed were randomly selected as reference points, and
the others were used as training samples. Out of the 150 points, 75 points per class