Geoscience Reference
In-Depth Information
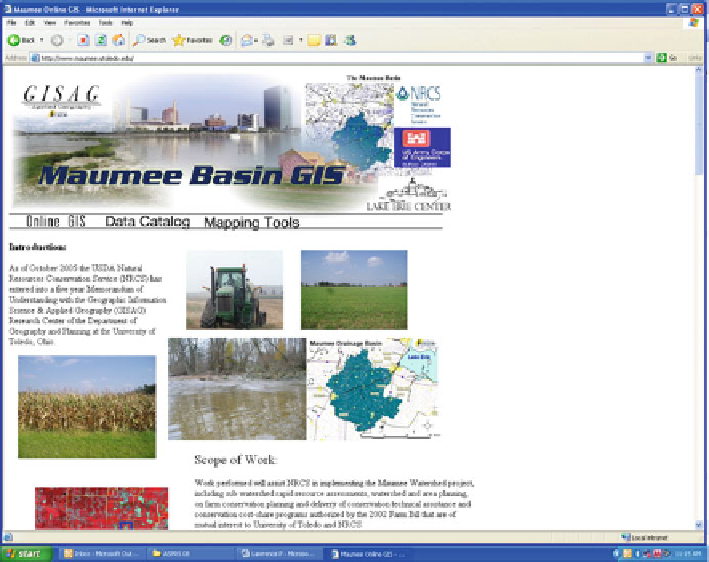
Fig. 8.2 Maumee GIS project website (at
www.maumee.utoledo.edu
)
For example, Fig.
8.3
shows the view scale of the entire watershed area highlighting
the individual river basins located within the watershed with additional layers includ-
ing land use/land cover, 2005 NIAP imagery, ecoregions and state boundaries.
Figure
8.4
illustrates a view at the scale of one river basin with display of the Land
Capability Class and additional layers that include counties, zip codes, annual precipi-
tation, farmland class and many others. Figure
8.5
displays the view at the local
community scale highlighting SSURGO soil types and also can include Census
blocks, streets, and several other additional data layers. ArcIMS also provides numer-
ous data tools to assist with spatial analysis including query functions, distance
calculations, and area measurements - all of which can be useful to potential users
of the datasets.
8.4 Remote Sensing
Land cover and land use can be classified for a watershed region by utilizing a
satellite image which covers a large area. Landsat Thematic Mapper can be used at
the regional level with its 30 m spatial resolution (Oetter et al.
2000
; Jensen
2005
;