Geoscience Reference
In-Depth Information
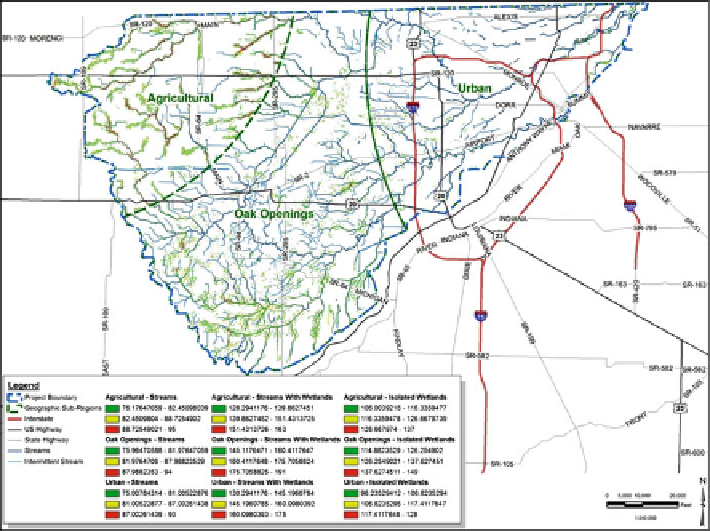
Fig. 7.5 Top 30% priority areas by subregions (Agricultural, Oak Openings, Urban) and by type
(Streams, Wetlands, Isolated Wetlands)
900 sites over the entire study area (two watersheds). Using GIS vector/ Hot Spot
analysis, the 900 sites were then clustered into groups of adjacent sites and
converted to a smaller number of central points or individual centroids. Based on
the average score from the combined site ties, each centroid was then assigned a
score. The analysis attempted to identify areas of high concentrations of quality
locations. This method failed due to the detail of the resolution of the model.
Using an alternative approach, each cell within the top 10% was combined with
all of its adjacent cells. These merged clusters were then assigned a score based on
their centroid. The cell clusters were then ranked based on these scores. Tables were
generated ranking all of the scores by cell cluster. The tables were examined for
natural splits between the top several clusters. The top clusters were recorded.
At this time, the polygons were renamed based on the rank, type and subregion.
This revised nomenclature distinguished which clusters had the highest relative
ranking in each of the subregions and by type. For example, the highest ranking
isolated wetland in the agricultural subregion was identified as IA1. After reviewing
the results of the model output, it was decided that the three different types should
be added to the same layer and clusters should include and be influenced by the
presence of multiple types. Figure
7.6
shows an example of the output mapping to
create grouped polygons.