Geoscience Reference
In-Depth Information
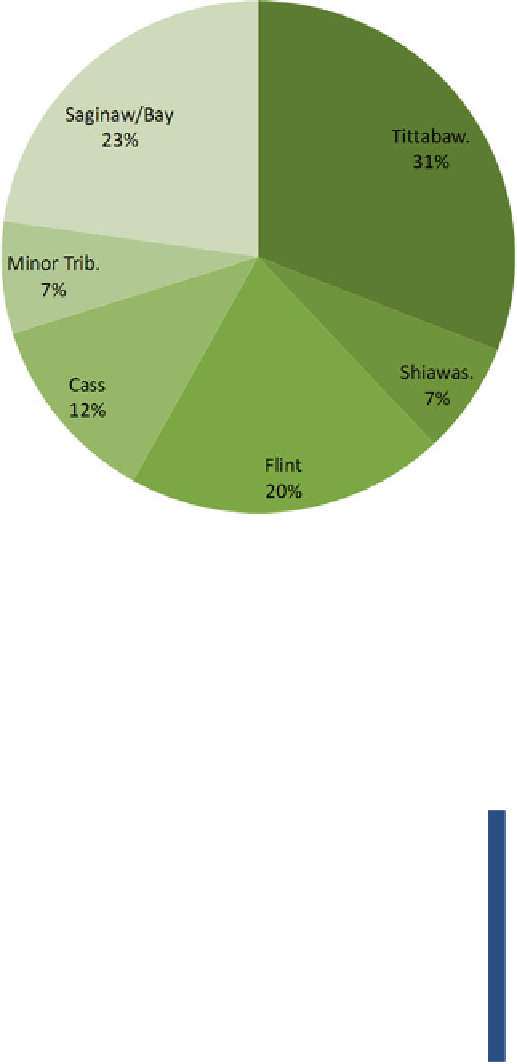
Fig. 6.5 Average contribution of sub-watersheds to the total load of Saginaw River in 1997-2008
800
6000
Load
700
5000
600
4000
500
TargetTP load
400
3000
300
2000
200
1000
100
0
0
97
98
99
00
01
02
03
04
05
06
07
08
Ave.
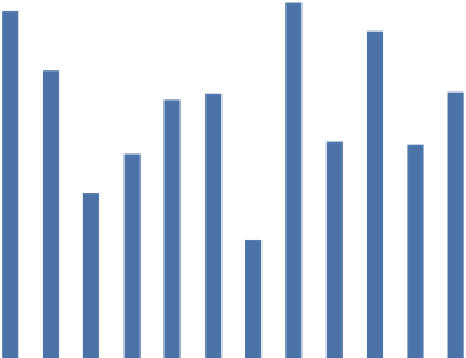
Fig. 6.6 Saginaw River's annual TP load estimates