Geology Reference
In-Depth Information
Limestone joint - first stage
3
90
80
70
2
60
50
40
1
30
20
Vert. displ.
τ
10
0
0
0
12345 67
Horizontal displacement, mm
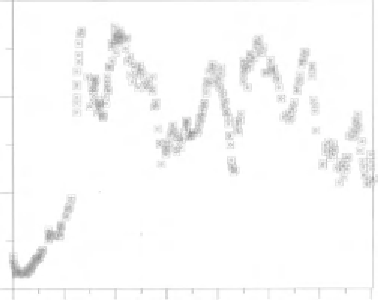
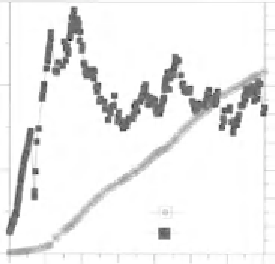
Figure 5.20 Results from single stage of direct shear test on rough induced tensile fracture through
limestone. Upper curve shows very spiky shear stress against displacement. The lower line shows
vertical vs. horizontal displacement (dilation) throughout this stage of the test. The line has a fairly
consistent gradient.
30
20
10
0
0
1
2 3
Horizontal displacement, mm
4
5
6
7
culties of obtaining and setting up samples. At each stage, the
normal load is generally increased (or decreased for experimental
reasons) and then the sample sheared until peak strength plus a few
mm. Tests must be properly documented, however, with photographs,
sketches and pro
the dif
les, so that any variable data can be explained
rationally (Hencher & Richards, 1989). Generally, it is found that