Geology Reference
In-Depth Information
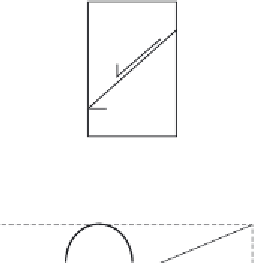
pressure changes as the sample is loaded and can be measured. In some
tests the sample is initially loaded and consolidated to a required
effective stress in an attempt to simulate the
field condition. Once the
sample is in equilibrium, it is gradually compressed axially whilst the
con
ning stress remains constant. The process is illustrated graphically
using Mohr stress circles in
Figure 5.13.
Note that within the sample,
the angle between
σ
1
and
σ
3
is 90 degrees, but in the Mohr circle
presentation,
field is expressed as a hemisphere
(180 degrees). The hemisphere represents the stress state on any
plane drawn through the sample. The test proceeds from the state
where
this
stress
1
is increased (hemispheres grow towards
the right) until the sample eventually fails. Normal stress on any
plane through the sample is measured on the horizontal axis, shear
stress on the vertical axis. The stress normal to a vertical plane through
the sample is
σ
1
=
σ
3
, then
σ
3
and the shear stress is zero; the normal stress on a
horizontal plane through the sample is
σ
σ
1
, the shear stress zero. These
planes are known as principal planes. For a plane inclined at 10
degrees (shown as 20 degrees graphically within the Mohr circle) the
normal stress on that plane is
σ
10
and at 45 degrees it is
σ
45
, with the
corresponding shear stress (
), as indicated. At failure, the shear plane
through the sample will be developed at some angle (
τ
θ
/2 degrees) to the
horizontal, expressed as
in the Mohr circle graph. The Mohr stress
circle representing the stress state at that stage is shown in
Figure 5.14
for a single test. Further tests would be carried out on other similar
samples at different con
θ
ne a strength
envelope (a line joining the stress states at which all samples failed).
Usually the envelope for a set of samples can be de
ning stresses and used to de
ned in terms of
friction (gradient of line) and apparent cohesion, c, which is the inter-
cept on the shear stress axis at zero normal stress (
Figure 5.4).
σ
1
σ
1
σ
45
σ
10
σ
3
σ
3
τ
45
10
°
τ
10
45
°
τ
45
τ
10
20
°
σ
45
σ
10
σ
3
σ
1
σ
1
σ
, Normal stress