Java Reference
In-Depth Information
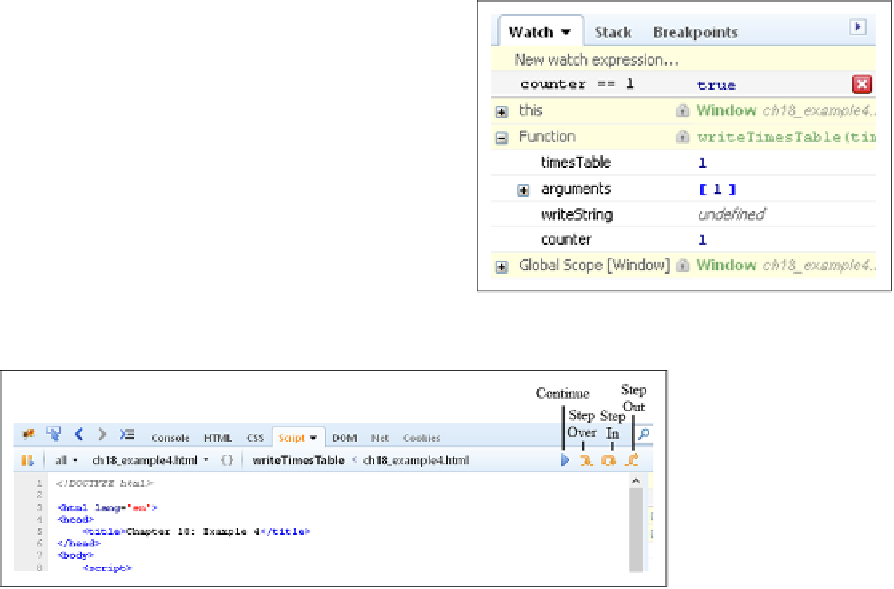
want to watch, and pressing the Enter key. Watches
that you add have a gray background, and moving
your mouse over them reveals a red Delete button
(Figure 18-24).
Stepping through Code
At the top of the debugger window are the icons
for stepping through code (see Figure 18-25).
The Continue button (F8) is first, followed by Step
Into (F11). Next are the Step Over (F10) and Step
Out (Shift+11) buttons.
figure 18-24
figure 18-25
As you step through code, you can tell the current statement by its yellow highlight. Firebug also
uses a yellow arrow in the gutter to indicate the current line. Like Chrome, stepping through code
updates the web page.
the Console
Firebug provides a console window with the Console tab (Figure 18-26), and it works like the
console found in Chrome and IE. You can inspect any variable or expression within the context of
the scope or page, and you can use it to execute JavaScript.
debugging in safari
Safari's story is similar to IE's. Safari's rendering engine is called Webkit, and the folks that write
and maintain Webkit built a separate tool, codenamed Drosera, that contained the tools similar to
the other browsers. It was a separate download, and it required you to attach it to a specific Safari/
Webkit window. Today, Safari includes a tool called Web Inspector, and it provides the functionality
you would expect from a browser‐based suite of tools.
Safari's Web Inspector is disabled by default. To enable it, follow these steps:
1.
Click the Settings menu button and choose the Preferences option (see Figure 18-27).