Java Reference
In-Depth Information
figure 18-18
figure 18-19
figure 18-20
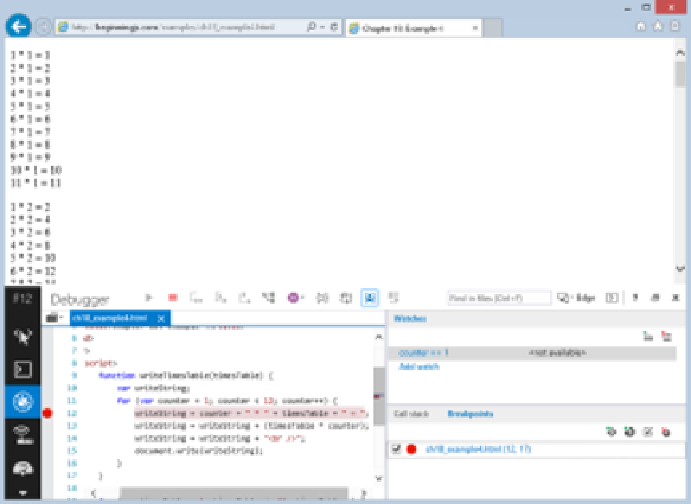
The F12 Developer Tools debugger denotes the current line by highlighting the line in yellow and
adds a yellow arrow in the gutter. But unlike Chrome, stepping through code does not update the
web page. The JavaScript executes, but you will not see the results until all code is executed.
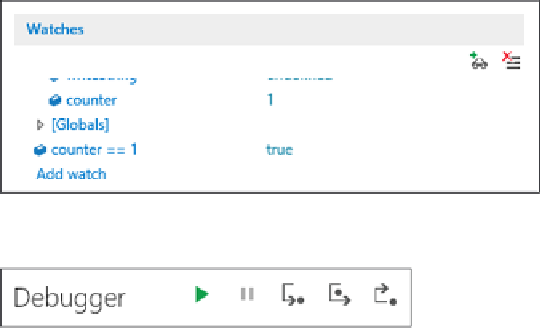
the Console
The console logs JavaScript errors and enables you to execute code within the context of the line at
which the debugger is stopped. Figure 18-21 shows the “Changed on the Fly” example.