Java Reference
In-Depth Information
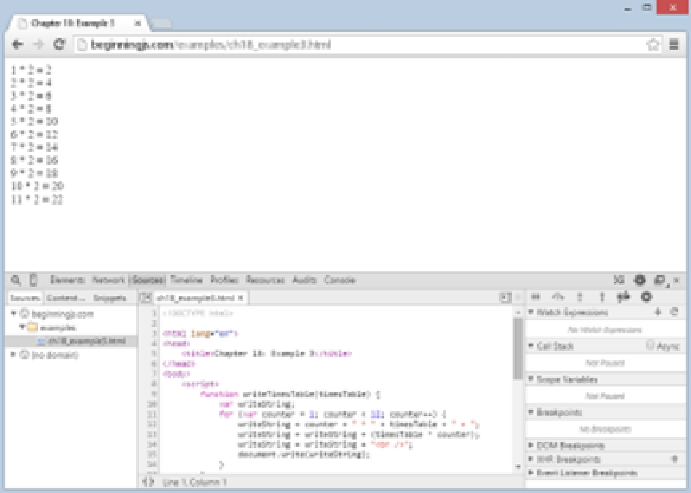
figure 18-4
Setting Breakpoints
As mentioned earlier, breakpoints tell the debugger to pause code execution at a specific point in
your code. This is useful when you want to inspect your code while it executes.
Creating breakpoints is straightforward. Simply left‐click the line number, and Chrome highlights
the line number with a blue tag icon. This highlight denotes a breakpoint in Chrome.
You can also hard‐code a breakpoint by using the
debugger
keyword directly in your code (we'll
use this a bit later).
Set a breakpoint on line 13:
writeString = writeString + (timesTable * counter);
Reload the page, and notice Chrome paused code execution at the newly created breakpoint.
Chrome highlights the current line of code in blue. This line hasn't been executed yet.
Look at the Breakpoints in the right panel; it shows you the list of breakpoints (only one in this
case). Each entry in the list consists of a checkbox to enable/disable the breakpoint, the filename and
line number of the source file, and the source text of the breakpoint.
Now look at the Scope Variables.
Scope Variables and Watches
The Scope Variables pane displays variables and their values currently in scope at the current line.
Figure 18-5 shows the contents of the Scope Variables pane at this breakpoint.