Information Technology Reference
In-Depth Information
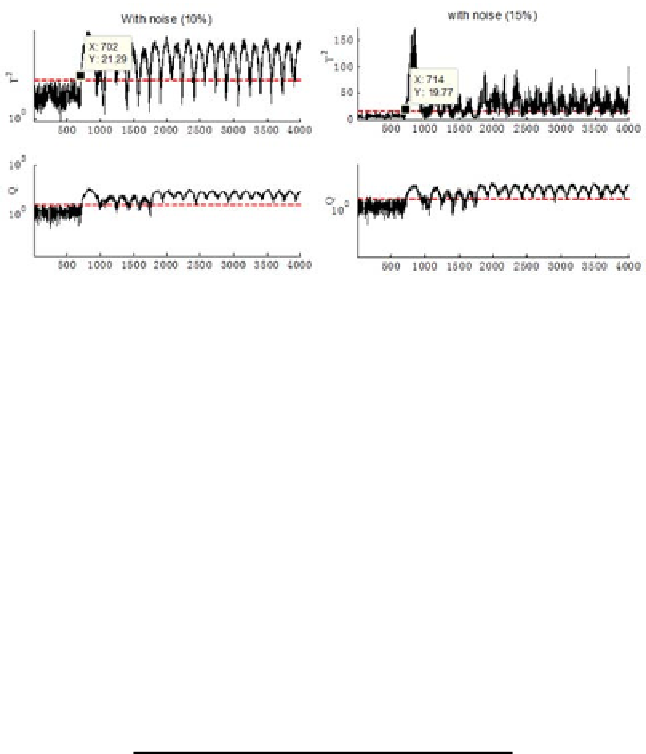
Fig. 5.
Monitoring chart for noisy faulty signals(left 10%, right 15%)
To set up a certain kind of SVM according to the fault type, the input con-
tains Training data matrix and Group data. For the training data, each row
corresponds to an observation, and each column corresponds to a feature. As for
the Group variable, each element of Group specifies the type of the correspond-
ing row of Training data. In this simulation, it consisted of logical number 1 and
0, which indicated belong to this certain type of fault and not belong to, re-
spectively. For the fault type, AG, BG and CG represented the phase-to-ground
fault, AB, BC, AC were the two-phases faults, ABC was the three phases fault
while N stands for normal condition with no fault. The radial basis function
with the default scaling factor of 1 was chosen as the kernel function to map
the training data into kernel space. Primary rough results has been simulated as
shown in Table.2.
Tabl e 2.
Table of SVM classification result
Faul t SVMs
Type
AG BG CG AB BC AC ABC N
AG 1,0 1,0 1,0 1,0
1,0
1,0 0,0 0,0
BG 1,0 1,0 1,0 1,0
1,0
1,0 0,0 0,0
CG 1,0 1,0 1,0 1,0
1,0
1,0 0,0 0,0
AB 0,0 0,0 0,0 1,0
1,0
1,0 0,0 0,0
BC 0,0 0,0 0,0 1,0
1,0
1,0 0,0 0,0
AC 0,0 0,0 0,0 1,0
1,0
1,0 0,0 0,0
ABC 0,0 0,0 0,0 0,0
0,0
0,0 1,0 0,0
N
0,0 0,0 0,0 0,0
0,0
0,0 0,0 1,0
From the classification results, it can be seen that the performance of SVMs
were not satisfactory. Without optimal structure design and parameter choices,
SVMs can only correctly classify phase-to-ground, phase-to-phase and three
phases faults. The future work include to develop improved algorithm with op-
timized parameters and selected features as the inputs for SVM.


Search WWH ::

Custom Search