Information Technology Reference
In-Depth Information
3 The proposed Fault Detection Scheme
This paper introduces a monitoring scheme that extracts the features of different
type of faults and find the fault inception point and fault type using PCA-SVM.
3.1 PCA Monitoring Scheme
In PCA, Hotelling's
T
2
and Q statistics are used to realize monitoring of the pro-
cesses.TocomputePCAusingthecovariancemethod,severalstepsareintroduced:
1. Calculate the empirical mean and the empirical mean along each dimension.
2. Calculate the deviations from the mean.
3. Compute the eigenvalue and eigenvectors of the covariance matrix.
4. Calculate the cumulative energy content for each eigenvector and chose the
basic vectors.
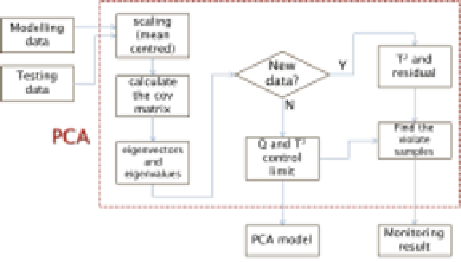
Fig. 1.
Diagram of PCA monitoring scheme
After establishing the PCA model from the training data, the control limit
of the
T
2
and Q statistics can also be determined, the new data set can be
computed and get the new
T
2
and Q value and compared with the PCA model
and the statistics, as shown in Fig.1.
Fig.1 shows the diagram of PCA algorithm when used in monitoring. In gen-
eral, the conventional PCA-based fault detection methods use
T
2
and SPE or Q
statistics. The confidence limits for these indicators are calculated based on the
assumption of the multivariate normality of observations and errors, respectively.
3.2 SVM Classification
For data generated from different type of faults, PCA can reduce the dimension of
the huge data significantly. During the process of PCA, an intermediate result
matrix is produced, consisting of the eigenvalues of the covariance matrix of
the data sets. These elements are uncorrelated and independent, thus can be
considered as the main features for detecting the certain fault type. Therefore,
at the same time with data dimensionality reduction, features extracted by PCA
can be used to build the corresponding feature data-base.

Search WWH ::

Custom Search