Information Technology Reference
In-Depth Information
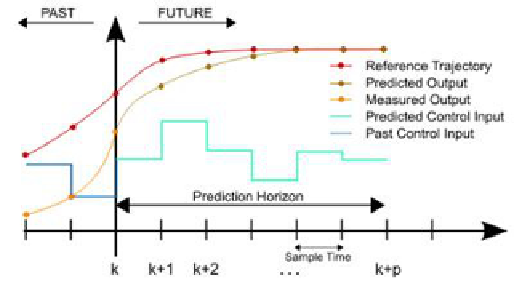
Fig. 2.
Predictive Control Schematic
presented the SSPC (state space predictive control) or SFPC (state feedback
predictive control) in 1993 [12]. All of these are called model-predictive control
algorithm, which is the general name of control algorithm based on models. Gen-
erally speaking, predictive control algorithm is constituted by three parts which
are predictive model, rolling optimization and feedback correction, as shown in
figure 2: Because of its successful applications in many areas, predictive con-
trol is started to be applied in fossil power plant. Literature [13] discusses the
application of DMC in the control of power-generating units on both theory
and practical, in which power, steam pressure and steam temperature are used
as manipulated variables. The DMC control method is used in steam tempera-
ture in [14]. For the controlled object with single input and single output, the
control results are better than traditional PID. In [15], the simulation result of
reheated steam temperature controlled by DMC combining with state feedback
is given.[16] presented a self-adaptive DMC method of traditional unit and used
the third-order model as the simplified model. In [17], for the superheater and
reheater temperature control, a 44 input output model was built and the simula-
tion results were presented. In the paper, step response was applied to establish
dynamic response matrix, and the manipulated variables were obtained through
online optimization.
4 System Analysis of Ultra-supercritical Units Control
The structure model of coordinated control system object of ultra-supercritical
units can be simplified into a three-input and three-output system, with the input
being the fuel quantity M(%), turbine valve opening T(%) and feed water flow
W (%), and the output being pressure before the turbine P(MPa), unit load
Ne(MW), outlet steam temperature of separator
θ
(
) or enthalpy (KJ/Kg).
The relationship of the input variables and output variables is shown in figure 3.
The solid line represents strong correlation and the dotted line represent weak
correlation[18]. In the range of certain working conditions, the model of the unit
Search WWH ::

Custom Search