Information Technology Reference
In-Depth Information
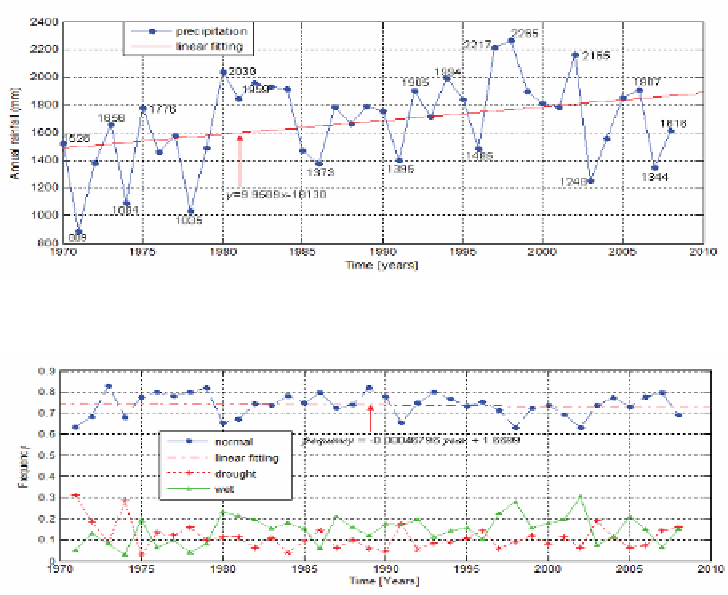
Fig. 3.
Average precipitation of 17 hydrometric stations and the associated linear trend
in the Fu river basin during the years 1970-2008
Fig. 4.
Frequency of the SPI 10-days of drought and flood in the years 1970-2008 based
on the average rainfall over the Fu river basin
To summarize, the overall precipitation amount is increasing gradually every
year from 1970 to 2008, and at the same time the precipitation spatial fluctua-
tions are increasing year by year in the Fuhe basin. The frequency of floods is
more intensive than the droughts. The basin's average drought time accounts
for 11.34% whereas the SPI-10 days is less than -1 and the basin's flood average
time accounts for 14.77% during 39 years from 1970 to 2008 whereas SPI-10
days is larger than 1, and the normal state of the basin where SPI-10 days lie in
[-1,1],that is not dry and not wet is 73.89 %.
4.2 Months Trends and Analysis
Fig. 5 shows the average monthly rainfall of the Fuhe basin. As can be seen the
month of June has the largest rainfall whereas the month of December has the
lowest, and the precipitation in December accounts for only 15% precipitation
of the month of June. Rainfall is concentrated in the months of April to June,
accounting for 46.85% of the annual rainfall. However, in the months of July,
August and September, the agricultural water usage peaks, and the precipitation
sharply declines, which have accounted for the 20.27% of the annual rainfall.
Search WWH ::

Custom Search