Information Technology Reference
In-Depth Information
test network and calculate its power flow distribution and voltage profiles at each
sample instant. A master programme was developed in Matlab to simulate the
operation of network over a period of time, with the following steps performed
at each sample instant:
(a) simulate EVs connecting and disconnecting to charge points;
(b) compute the instantaneous charge rates according to the AIMD algorithm
described in the previous section;
(c) generate updated OpenDSS simulation parameters;
(d) call the OpenDSS software to simulate the current state of the distribution
network.
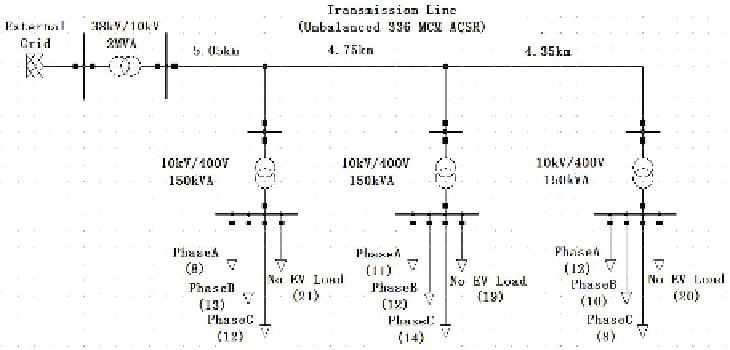
Fig. 1.
Schematic diagram of the distribution network
4 Case Study
Utility companies hope that in the short to medium term (10-20 years) smart
charging strategies will enable them to accommodate the extra loads represented
by EV charging without needing to upgrade their distribution network infrastruc-
ture. To predict the impact of EV charging on the grid we assume a maximum
penetration of EVs of 50% in the medium term and simulate the performance of
both uncontrolled and smart charging under these circumstances for typical Irish
winter grid loads. Residential power consumption winter profiles were generated
based on residential customer smart meter electricity trial data provided by the
Commission for Energy Regulation
(CER) in Ireland [12].
For our AIMD algorithm implementation
E
min
and
E
(
k
) are set in accordance
with [11],
ξ
=12,
P
rated
is set to 450kVA and
λ
=50kVA.
V
min
is selected as 0.9pu,
the minimum acceptable voltage level in Ireland, and the capacity limit of each
of the distribution transformers is set to 150kVA. Charging is performed in
accordance with the assumptions set out in Section 2.1. We also assume that
Search WWH ::

Custom Search