Information Technology Reference
In-Depth Information
Furthermore, the correlations of all the selected 42 genes are shown in Fig. 3,
some highly correlated genes can be chosen, i.e.,
{
}
{
}
{
}
672, 320
,
44, 186
,
93,75
,
{
. Fig. 4 shows the solution paths of the 320
th
and 672
th
gene. It can be seen again that as a new highly correlated gene was added to
the model, it immediately adjusted the previous parameter estimates so that the
correlated genes shared almost equal values. This indicates that the proposed
TSGS method can solve the gene correlation problem.
Finally, to compare the performance with the popular Elastic Net method, the
training data set randomly selected 4 OA and 14 RA samples, and the remaining
13 samples were use to test. The entire process was repeated 50 times, leading to
50 different training and testing data sets. The initial parameters
S
= 100 and
a small parameter set
Λ
=[0
.
5
,
1
,
5
,
10
,
50
,
100] for
λ
2
were set, respectively. The
proposed TSGS and Elastic Net methods were applied to the 50 training and
testing data sets, and 50 runs were performed. The statistical results, including
model size, training error and testing error are shown in Table 1. It is obviously
seen that the proposed method produced not only the more compact model but
also the better classification performance.
}
{
}
616, 204
and
529, 513
1
0.8
0.6
0.4
0.2
0
−0.2
−0.4
−0.6
−0.8
x
i
(i=1,...,755)
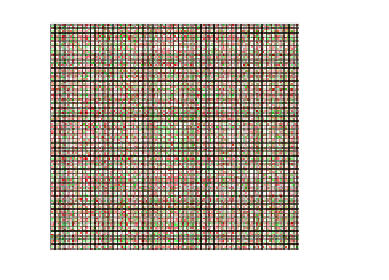
Fig. 1.
The correlations among All 755 genes
Tabl e 1.
Statistical performance of two algorithms
Method Arthritis
Model size 46
.
62
±
23
.
74
Elastic
Training error 0
.
44
±
1
.
11
Net
Testing error 1
.
56
±
1
.
05
Model size 27
.
32
±
22
.
90
TSGS Training error 0
.
48
±
1
.
05
Testing error 1
.
14
±
0
.
94


Search WWH ::

Custom Search