Information Technology Reference
In-Depth Information
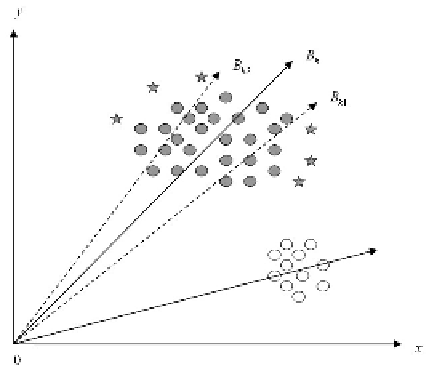
Fig. 1.
Illustration of further analyzing bases in NMSC
In Figure 1, the solid arrows denote the bases in the root level while the dashed
ones in the sub-level. Its obvious that all the data take non-negative directions in
the space. Here, we still take the basis
B
k
as an example. Although
B
k
is the basis
of the data in shade, its limited to eciently represent several data especially for
the marginal ones (stars) which have relatively low projection values on
B
k
.To
improve the local representation of the dataset, we tend to find sub-bases
B
k
1
,
B
k
2
,
for further analyzing the data. Specifically, in the process of expanding
B
k
, the data nearer to
B
k
should have larger sparseness than the others because
the data potentially contain more sub-level information of
B
k
. As a consequence,
these sub-bases serve to have more detailed and precise description of the data
in shade than only
B
k
.
···
2.3 Hierarchical Representation for the Data
In the proposed algorithm, each basis in any level if necessarily can be further
analyzed and decomposed into several bases in the next level, which connects all
the bases as a tree-like structure. Then, all the data tend to be correspondingly
put into the tree organization. Hence, this completes the hierarchical represen-
tation of the original data.
2.4 Plate Notation for NMSC Model
In this part, we utilize the plate notation [6], [7] to show NMSC model applied
in document clustering. Its graphically illustrated in Figure 2.
Search WWH ::

Custom Search