Information Technology Reference
In-Depth Information
25
3
Tra1
Tra2
Tra3
Tra4
Tra5
Tra6
Tra7
Tra8
Tra9
Tra1
Tra2
Tra3
Tra4
Tra5
Tra6
Tra7
Tra8
Tra9
2.5
20
2
15
1.5
10
1
5
0.5
0
0
0
5
10
15
0
10
20
30
40
50
60
70
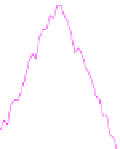
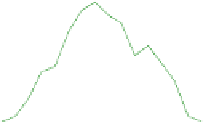
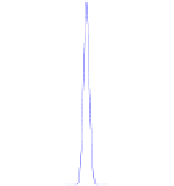
Fig. 1.
position and acceleration feature of 9 raw trajectory
5
3
Tra1
Tra2
Tra3
Tra4
Tra5
Tra6
Tra7
Tra8
Tra9
Tra1
Tra2
Tra3
Tra4
Tra5
Tra6
Tra7
Tra8
Tra9
4.5
2.5
4
3.5
2
3
2.5
1.5
2
1
1.5
1
0.5
0.5
0
0
0
1
2
3
4
5
6
0
2
4
6
8
10
12
14
16
18
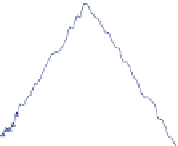
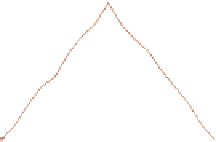
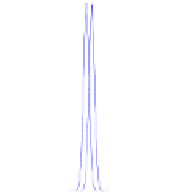
Fig. 2.
position and acceleration feature of main segments
2.5
1.5
2
1
1.5
1
0.5
0.5
0
0
−6
−4
−2
0
2
4
6
8
−6
−4
−2
0
2
4
6
8
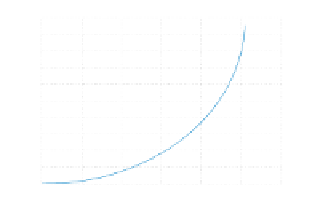
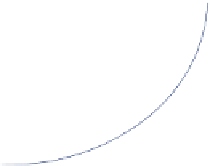
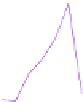
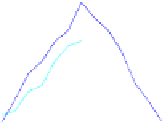
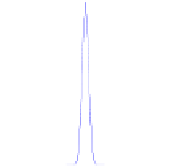
Fig. 3.
probability density distribution of points in Tra10 (left) and Tra7 (right)
3.2 Trajectory Matching
Tra10 is the same as latter part of Tra9. Gaussian Process Regression model is
built for Tra10 using main points extracted from Tra1,2,3,9 as training samples.
The left picture for Tra10 in Fig.3 shows that the most probability density
distribution curve has a small variance which means a thick distribution around
evaluated mean value. The corresponding actual acceleration value are in 90%
confidence interval. The right one in Fig.3 shows the curve of the probability
density distribution of points in Tra7. Those points variances are too big to have
a dense distribution for their acceleration value. This is not an ideal Gaussian
distribution though, the experiment result shows that their actual acceleration


Search WWH ::

Custom Search