Information Technology Reference
In-Depth Information
results still contradict with the requirements, therefore braking mode is started.
X3 is in the last section and a train starts coasting for a while from X3 and
changes to brake to stop in the station accurately.
Tabl e 2.
Track Alignmemt and Speed Limit
Distance(m) Grade(%) Radius(m)
V
max
(Km/h)
0 -160
0
3000
50
160-205
0
3000
65
205-663
-2.74
400
65
663-818
-2
0
70
818-985
-2.7
1000
70
985-1266
-0.91
0
75
1266-1738
-1.01
600
65
1738-2032
-0.33
0
30
2032-3034
0.13
1500
70
3034-3060
0.32
0
70
3060-3200
0.2
0
55
80
70
60
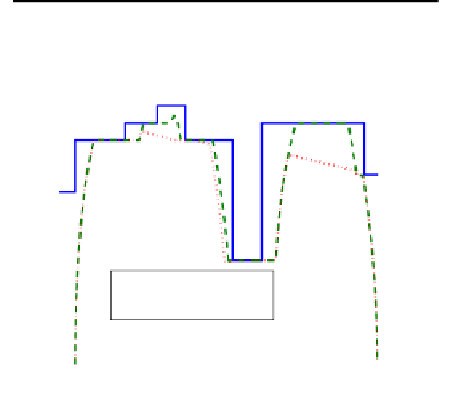
X1
X2
X3
50
40
30
Maximum allowed speed
Time−efficient speed
Energy−efficient speed
20
10
0
0
500
1000
1500
2000
2500
3000
3500
Distance (m)
Fig. 3.
Train traction operation curve under different modes
According to the simulation results in Table. 3, after optimization, though
there is a slightly increase of running time by 4.56%, the energy consumption
between two stations decreased significantly by 27.58%. In the previous study,
Bocharnikov et al developed a model to optimize the timing of coasting as-
sociated with varying acceleration and deceleration rates with GA(2007). The
method was applied to a 8.53-km track segment, accordingly 31.27% of energy
consumption was saved albeit the travel time increased by 12.5%. It was found
that here proposed optimization is very effective.


Search WWH ::

Custom Search