Information Technology Reference
In-Depth Information
Tabl e 3.
The Sensitivity and Comprehensive Sensitivity of Former Eight Buses
order node number
LM
i
order node number
Li
1
10
2.075
1
12
4.4253
2
12
2.065
2
15
4.4125
3
29
2.061
3
20
4.3598
4
15
2.058
4
10
4.3560
5
20
2.056
5
29
4.2681
6
14
1.041
6
19
2.1591
7
26
1.036
7
21
2.1035
8
19
1.030
8
14
2.0159
C. N-1 Contingency Analysis
a. Branch Contingency
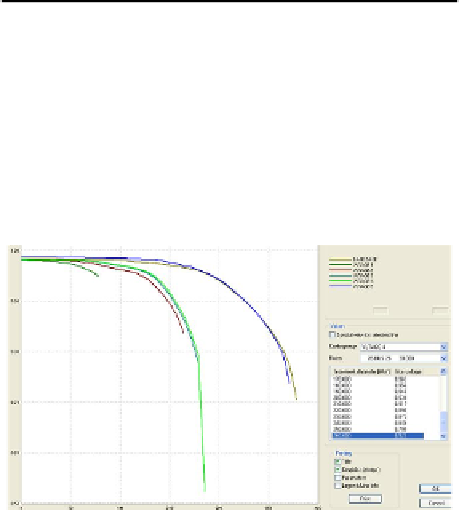
Fig.4 shows the transfer power limit at base case and the first five contingencies.
It can be seen, due to the change of network structure, the transfer power limit of
the system changes, and then the system load margin has been greatly reduced,
namely, the ability of the system with a large load diminishes greatly.
Fig. 4.
PV curves at base case and former five contingencies
In Table 4, it can be seen that at the three kinds of contingencies, the order of
node has not changed, and the transfer reactive power limits have little change.
This is due to that the contingencies occur at the 132 KV voltage level. However,
the weak buses always appear on the 33 KV voltage level.
From Fig.5, it's easily seen that the transfer reactive power limit of node 4
has a big change at base case and the first three contingencies, which is greatly
different from Table 4.
b. Generator Contingency
Fig.6 shows the PV curves of bus 4 at base and five single generator contingen-
cies. It can be seen that the single generator outage has a significant impact on
the transfer power limit.


Search WWH ::

Custom Search