Information Technology Reference
In-Depth Information
Tabl e 1.
Branch Contingency Ranking in Order of Severity
order branch number PI value
1
Bus 1 to Bus 2 0.5756
2
Bus 2 to Bus 5 0.4604
3
Bus 1 to Bus 3 0.3922
4
Bus 3 to Bus 4 0.3807
5
Bus 6 to Bus 7 0.3721
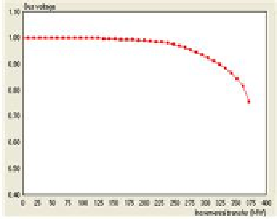
(a) PV curve of bus 26 at base
case
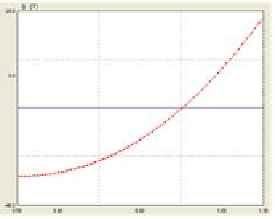
(b) QV curve of bus 26 at base
case
Fig. 3.
Base case
bus. Among them, bus 26,30,29 reactive power margin are small, which easily
leads to system voltage instability. Therefore, the strengthening of reactive power
compensation of these nodes is of great significance to system voltage stability.
Tabl e 2.
Reactive Power Margin in Order at Base Case
order node number reactive power margin (MVAR)
1
26
31.17
2
30
33.14
3
29
36.83
4
25
66.75
5
27
72.52
6
18
81.58
Table 3 shows the former eight buses' voltage sensitivity
LM
i
and the compre-
hensive sensitivity indicator Li in order. Compared to Table 2, we can see that
the voltage sensitivity has no necessary relationship with the reactive power mar-
gin, as they are two kinds of different evaluation indicators. In addition, from
the order of
LM
i
and Li in Table 3, although some changes occurred in the node
sort, but the bus of large sensitivity still maintained at the previous position.
From the order of bus 14,26, it shows that the change rate of the sensitivity has
an significant impact on the voltage sensitivity.


Search WWH ::

Custom Search