Information Technology Reference
In-Depth Information
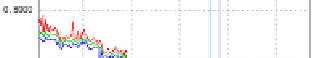
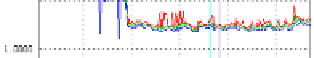
Fig. 6.
The harmonic current by FC and TSC
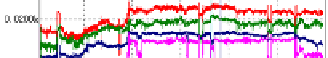
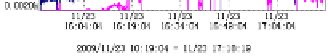
Fig.7.
The harmonic current by FC, TSC and PPF
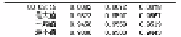
Table 5.
Harmonic current of 6.3KV bus by fc, tsc and ppf A
harmonic current
harmonic order
5
7
11
13
allowed value
63.04
44.50
29.66
29.66
average values
111.60
11.40
10.80
7.00
FC+TSC
40.20
23.10
10.30
7.50
FC+TSC+ PPF
12.60
10.10
2.40
4.00
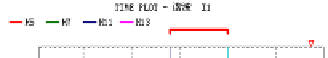
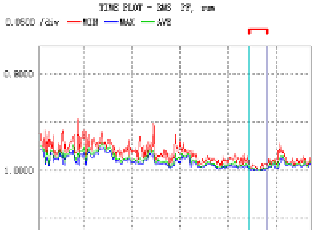
Fig.8.
Power factor by FC and TSC
Fig.9.
Power factor by FC, TSC and PPF
Figure8 and Figure9 show that though the maximum power factors reached 0.96
there still were some surges of reactive power by the action of FC and TSC only.
Figure 13 indicates that the negative effect can be eliminated by the PPF.
5
Conclusions
This paper aims at promoting development of the smart grid by controlling the power
quality of the power system. For this purpose, a thermodynamics modeling method
was used to analyze the stability and performance of typical filter and reactive power


Search WWH ::

Custom Search