Information Technology Reference
In-Depth Information
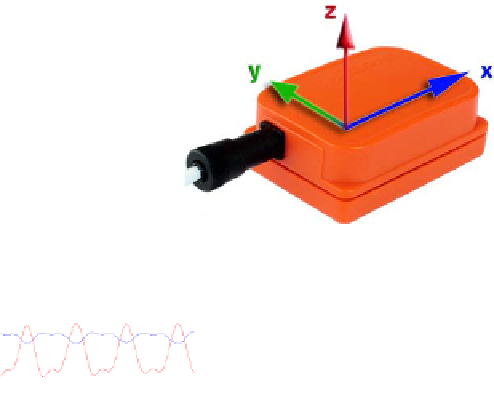
Fig. 1.
MTx sensor unit
B
i
ceps curl
T
r
iceps curl
B
e
nch pres
s
10
20
20
0
10
10
-10
0
0
-20
-10
-10
0
2
4
6
8
10
0
2
4
6
8
10
0
2
4
6
8
10
time
time
time
Flies
B
e
nt-over ro
w
L
a
teral row
10
5
20
0
0
10
-5
-10
0
-10
-20
-15
-10
0
2
4
6
8
10
0
2
4
6
8
10
0
2
4
6
8
10
time
time
time
Overhead pre
s
s
Deadlift
Stan
d
ing calf r
a
ise
20
10
5
0
10
0
-5
0
-10
-10
-10
-20
-15
0
2
4
6
8
10
0
2
4
6
8
10
0
2
4
6
8
10
time
time
time
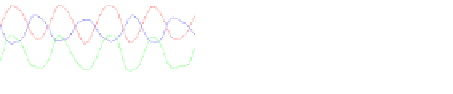
Fig. 2.
Curve of acceleration data filtered by 5th Order Butterworth Filter in each of the nine
exercises. X-axis is shown with red line. Y-axis is shown with blue line. Z-axis is shown with
green line.
2.2
Recognition Method
The process of recognition is listed below:
(1) Get acceleration series of each repetition from data stream using peak analysis.
(2) Set up reference series library of all types of weight exercises.
(3) Calculate warping distance between test series and every reference series.
(4) Recognize class of exercises based on the minimum distance based on DTW.
How to get time sequence data of each repetition from acquisition data stream is an
important step of this method. As shown in Fig. 2, the x-axial acceleration fluctuates
violently, which is chosen as the major axis. Then time sequence can be split from
data stream by two adjacent peaks.


Search WWH ::

Custom Search