Biomedical Engineering Reference
In-Depth Information
effect of the dissolution self-inhibition was detected by the authors
of the calcium-rich layer formation model [19, 44-48], although the
interpretation of this effect was quite different (see above).
(a)
(b)
(c)
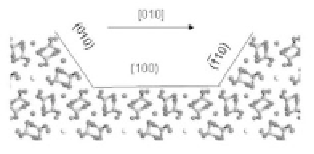
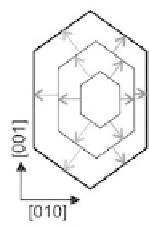
Figure 7.3
A typical etch pit on the surface of calcium apatites. (a) Top
view and a model of its evolution during dissolution. Arrows
represent relative step velocities displaying different facets.
(b) View through the [001] direction in the (100) surface.
The exposed step faces can be seen to be un-equivalent owing
to the opposite orientations of the orthophosphate groups.
Reprinted from Ref. [109] with permission. (c) Schematic of
the evolution of hexagonal etch pits. Four differently colored
arrows represent relative step velocities. Reprinted from Ref.
[111] with permission.
Different acids were used in experimental investigations but,
unless the conditions of surface coating creation [113], no specific
influence of the acids to etch pit formation and growth was found


Search WWH ::

Custom Search