Biomedical Engineering Reference
In-Depth Information
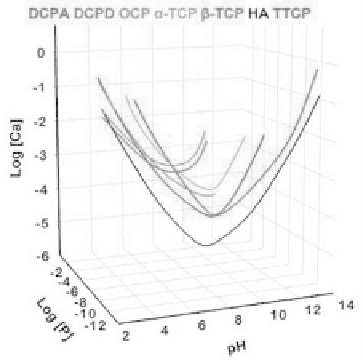
Figure 1.6
Top: a 3D version of the classical solubility phase diagrams
for the ternary system Ca(OH)
O. Reprinted from
Ref. [122] with permission. Middle and bottom: solubility
phase diagrams in 2D graphs, showing two logarithms of the
concentrations of (a) calcium and (b) orthophosphate ions as
a function of the pH in solutions saturated with various salts.
Reprinted from Ref. [123] with permission.
-H
PO
-H
2
3
4
2


Search WWH ::

Custom Search