Database Reference
In-Depth Information
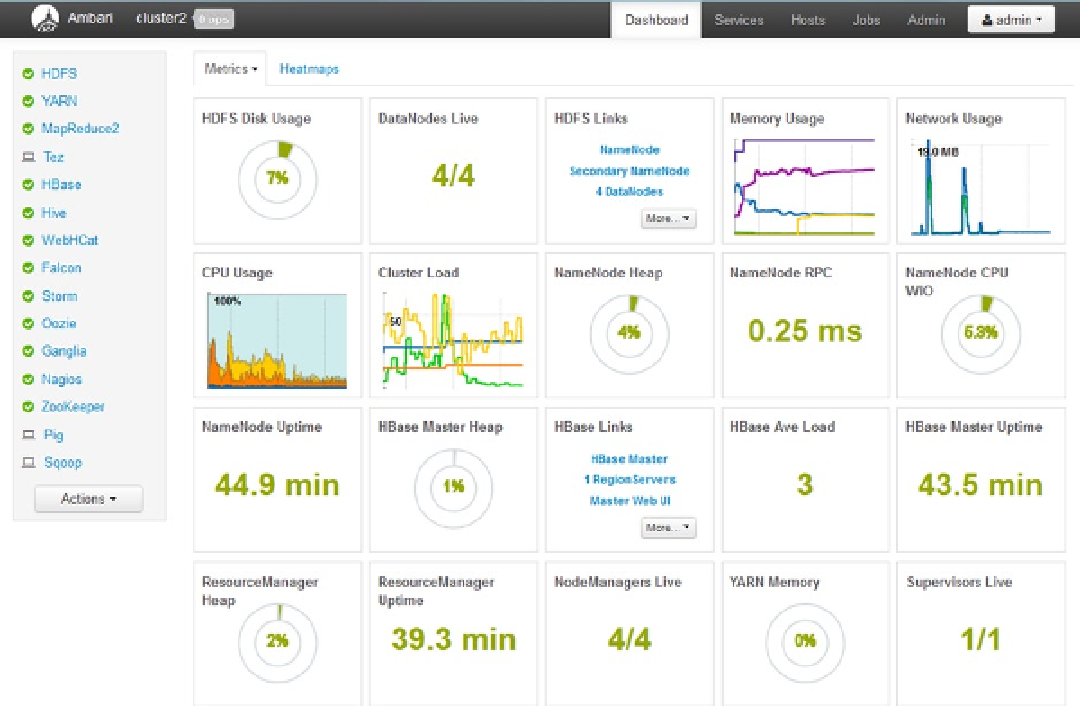
Figure 8-5.
Ambari dashboard
The dashboard is the cluster manager home page, and the black menu bar at the top of the page allows me
to select the Dashboard, Services, Hosts, Jobs, or Admin functions. The service list on the left side of the display
allows me to access service-specific details—for example, HDFS. The dashboard display has two tabs—Metrics and
Heatmaps—each of which I will examine shortly. For instance, the Metrics window basically shows the state of the
cluster's resources.
Clicking one the resource icons provides me with a larger, more detailed display of that cluster resource type. For
instance, I click CPU Usage and get the results shown in Figure
8-6
. Specifically, what Figure
8-6
shows is CPU usage
for the last hour. The display is color-coded, with a corresponding key; in this instance, user CPU usage exceeds that
of system usage. It also shows that the cluster resources are being under-utilized, as CPU usage rarely exceeds 50
percent. Also, there is a table of minimum, average, and maximum CPU values for each category. I click OK to close
that display.
Search WWH ::

Custom Search