Database Reference
In-Depth Information
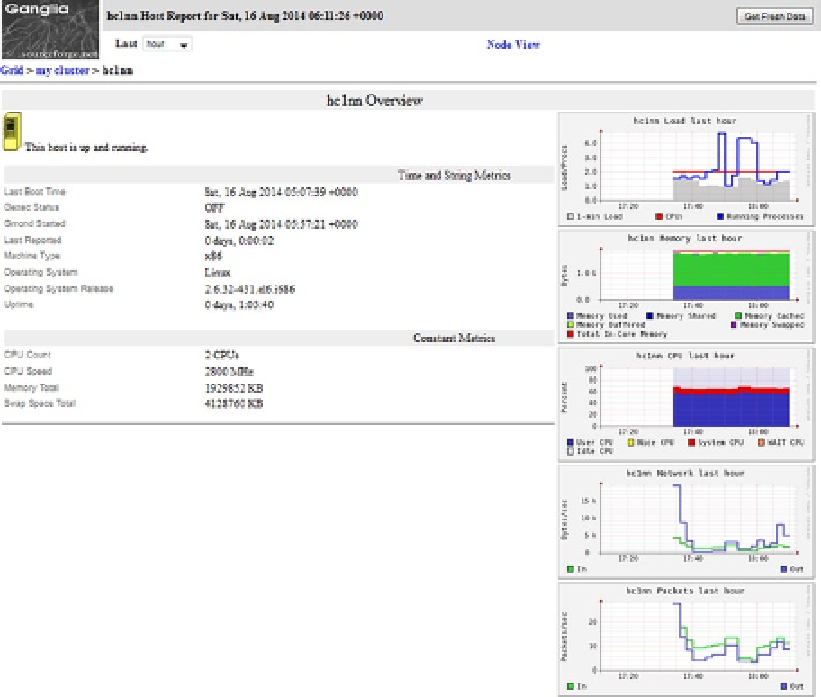
Figure 7-16.
Ganglia node display
The second half of the screen, shown in Figure
7-17
, contains a large number of sections and resource graphs.
Because there are so many available, I have selected just a few to display here. However, each is composed of CPU,
disk, load, memory, network, and process graphs. Each category of function being monitored has a number of
aspects: for instance, CPU shows system user and input/output characteristics.
Search WWH ::

Custom Search