Database Reference
In-Depth Information
If you see an error similar to the following in the /var/log/messages file:
Aug 16 17:28:55 hc1nn /usr/sbin/gmetad[7861]: data_thread() got no answer from any [my cluster]
datasource
check on each server that the Ganglia gmond processes are running. If necessary, restart them using the Linux
service
command as the root user:
service gmond restart
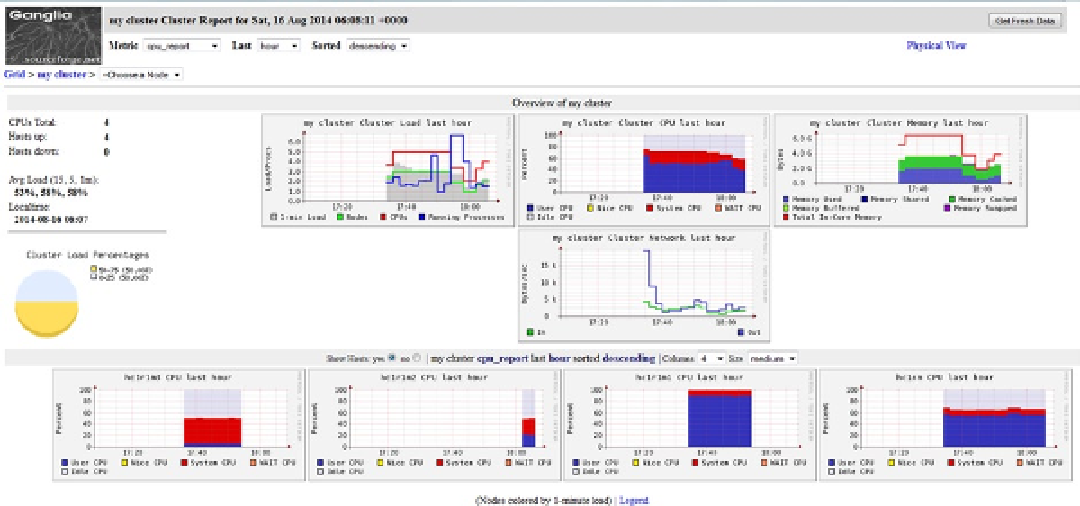
The Ganglia Interface
The Ganglia cluster web interface offers an overview of the cluster and a series of clickable icons that represent each
server in the cluster that has been configured to collect data. Figure
7-15
shows the default CPU-based display of the
cluster.
Figure 7-15.
Ganglia overview display
In Figure
7-15
, notice the Get Fresh Data button (top right) for refreshing your data and the Metric drop-down
menu (top left), from which you can choose to display network, packets, memory, and load information. The visual
display of server states enables you to drill down into those servers that appear to be taking the greatest load. For
example, click on the Name Node display (hc1nn), and you'll get a detailed display for that server. As you can see in
Figure
7-16
, the display provides information about the Ganglia processes, such as when they started and how long they
have been running. It also provides information about the server's memory and CPU configuration. Click the images on
the right of the screen to reveal detailed graphs for the server's load, memory, CPU, network, and packet usage.
Search WWH ::

Custom Search