Database Reference
In-Depth Information
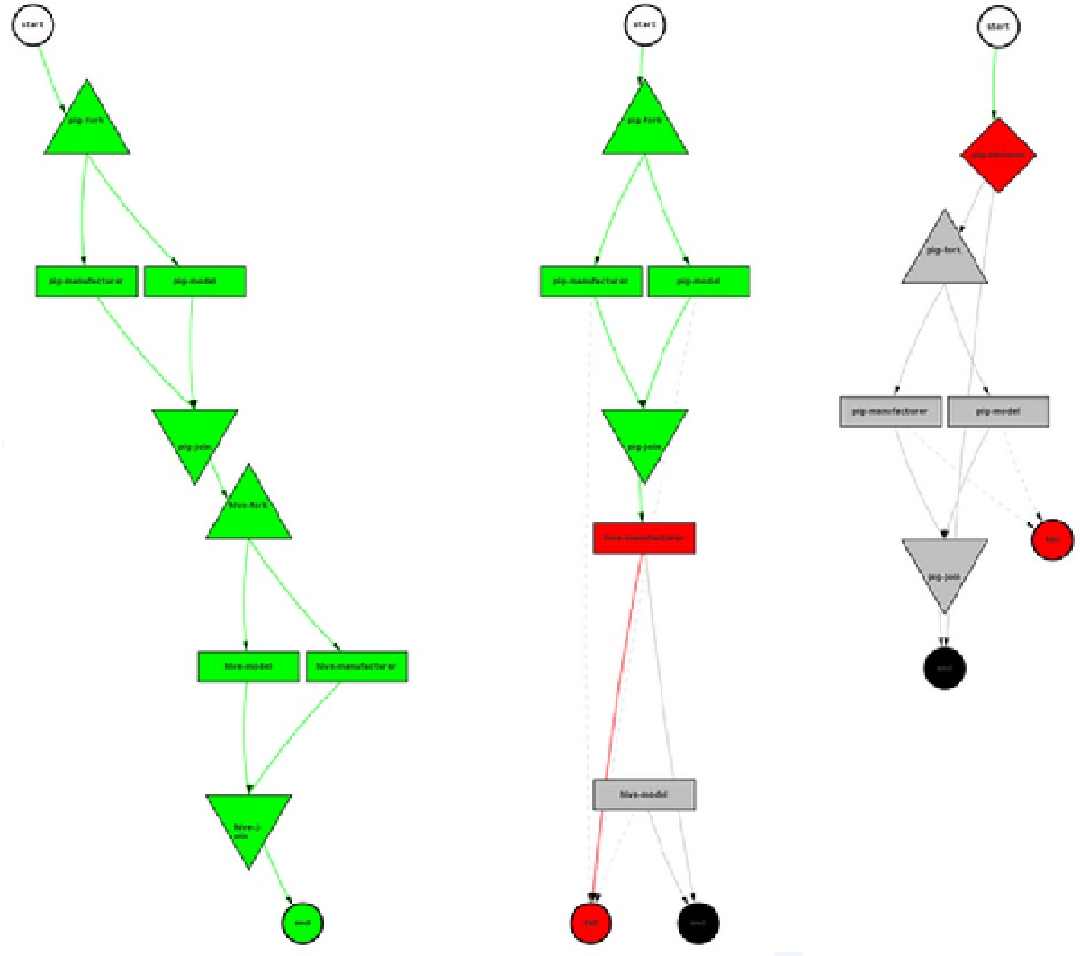
Figure 5-9.
Oozie job DAG information for three jobs
Figure
5-9
shows three different DAGs. The text is illegible because the figures have been minimized to fit
together on a single page, but you can see the different states that nodes in a DAG can achieve.
For instance, in Figure
5-9
the circles show the start and endpoints, while the triangles show the forks and joins.
The boxes show the actions to be executed, while the actions between a fork and join show that they will be executed
in parallel. The color codes indicate the execution states: gray means that a node has not been executed, green means
that that node has executed sucessfully, red means that an error has occurred, and black is the unreached endpoint.
That is, the DAG on the left completed successfully and the two on the right failed.

Search WWH ::

Custom Search