Environmental Engineering Reference
In-Depth Information
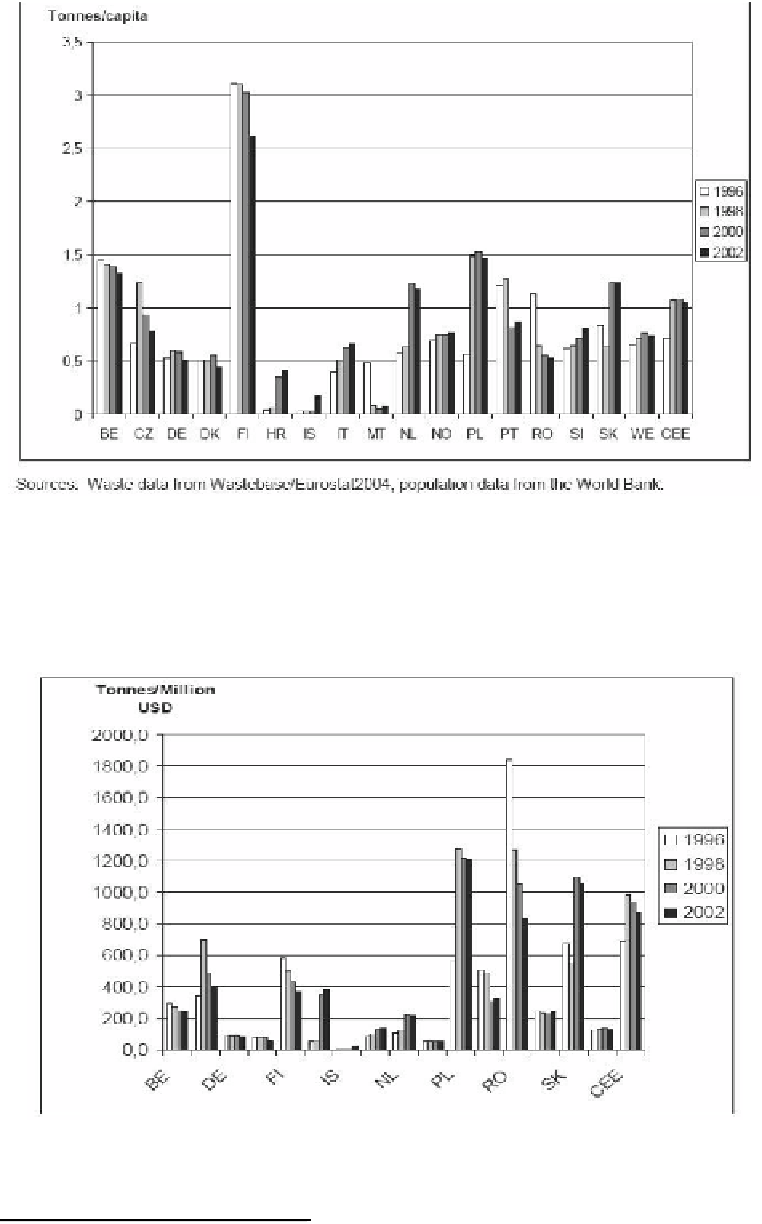
Figure 7. Trends in generation of manufacturing waste per capita.
Figure 8 shows the manufacturing waste generated per gross value added
1
in the
manufacturing sector.
Figure 8. Trends in manufacturing waste generation per gross value added in the manufacturing sector.
1
In national accounts such as the United Nations System of National Accounts (UNSNA) or the NIPA's, gross
value added is obtained by deducting intermediate consumption from gross output. Thus gross value added is
equal to net output. (http://en.wikipedia.org/wiki/Value_added)