Environmental Engineering Reference
In-Depth Information
336
350
322
300
250
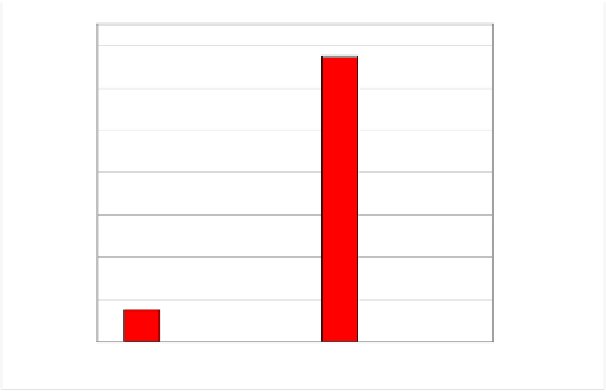
Total GHG
CO2
N2O
CH4
200
150
100
37
50
27
9
7
8
0.61
-
Biorefinery
Fossil reference system
Figure 17. Comparison between GHGs of biorefinery and fossil reference system.
Going into details, about 33 kt CO
2
-eq./a are released by feedstock production and
biorefinery plant activities, with the following shares:
•
61% of these emissions comes from feedstock provision (e.g. collection of wood
residue, pelleting and transport),
•
16% from lignin and process residue combustion for CHP production (i.e. emissions
of CH
4
and N
2
O),
•
23% from manufacturing of auxiliary materials such as urea (9%), sulfuric acid,
phosphoric acid (5.7%), sodium hydroxide (5%) and others.
In addition to these emissions, distribution and final use of products are responsible for
an emission of 3.8 kt CO
2
-eq./a (coming from combustion of transportation biofuels in
passenger cars (95%) andfrom combustion of biomethane in its final application (5%)).
Table 7. GHG emissions of the fossil reference system.
Fossil reference
system
Product/service
kt CO
2
-eq./a
%
Transportation (gasoline)
227
67.6%
FUMA (from fossil)
4.31
1.3%
Epoxy resins (from fossil)
17.7
5.2%
Electricity (from natural gas)
39.8
11.8%
Heat (from oil)
23.8
7.1%
Natural gas
21.9
6.5%
H
2
(from natural gas)
987
0.3%
O
2
(conventional)
509
0.2%
Total GHG emissions
336
100.00%