Graphics Reference
In-Depth Information
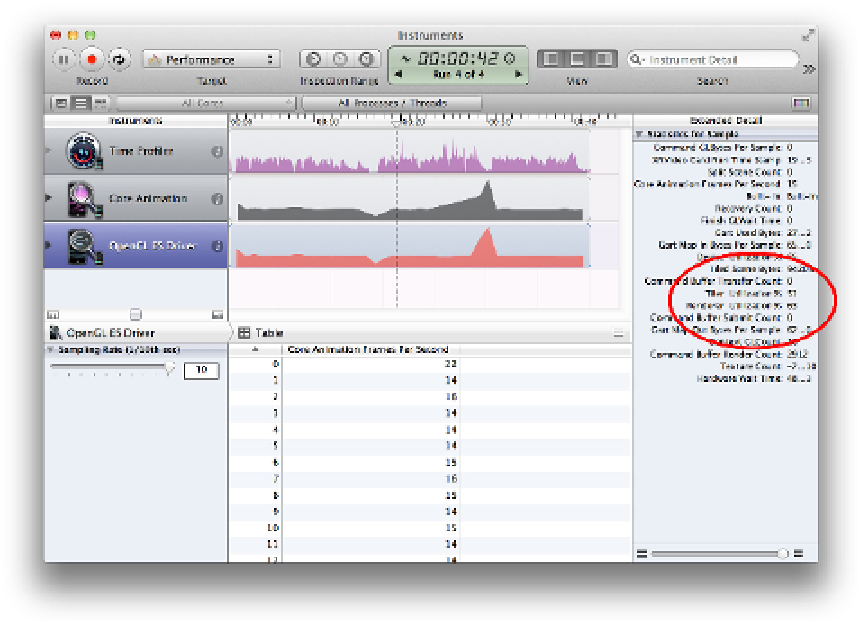
Figure 12.9
GPU utilization displayed in the OpenGL ES Driver tool
The tiler and renderer utilization values are at 51% and 63%, respectively. It looks like the
GPU is having to work pretty hard to render our contacts list.
Why is our GPU usage so high? Let's inspect the screen using the Core Animation tool
debugging options. Enable the Color Blended Layers option first (see Figure 12.10).