Graphics Reference
In-Depth Information
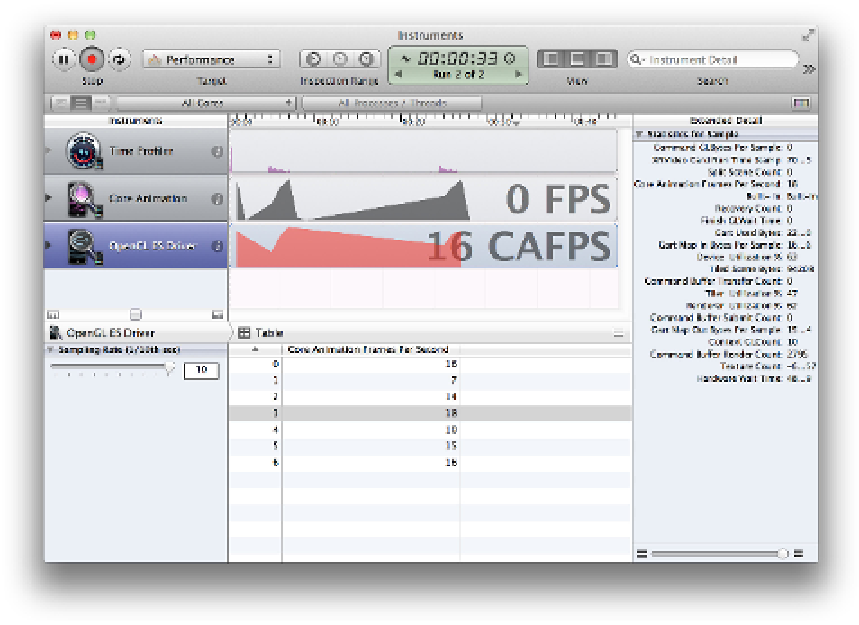
Figure 12.6
The OpenGL ES Driver tool
In the right sidebar are a number of useful metrics. Of these, the most relevant for Core
Animation performance are as follows:
▪
Renderer Utilization
—If this value is higher than ~50%, it suggests that your
animation may be fill-rate limited, possibly due to offscreen rendering or overdraw
caused by excessive blending.
▪
Tiler Utilization
—If this value is higher than ~50%, it suggests that your animation
may be geometry limited, meaning that there may be too many layers onscreen.
Now that we are familiar with the animation performance tools in Instruments, let's use
them to diagnose and solve a real-world performance problem.
We'll create a simple app that displays a mock contacts list in a table view using fake friend
names and avatars. Note that even though the avatar images are stored in our app bundle, to
make the app behave more realistically we're loading the avatar images individually in real