Environmental Engineering Reference
In-Depth Information
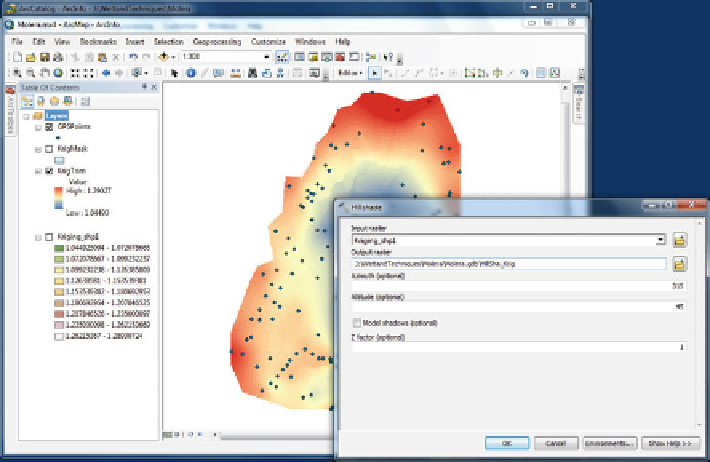
Fig. 2.21 An example of the hillshade dialog box
2.4.1.3 Visualizing Wetland Geometry
The DEM can be displayed so each range of depth can be associated with a color.
This operation will color the DEM by elevation. You have many choices, and the
selection will be dictated by the information you are seeking. Two standard
coloring methods are 1) “stretched” color ramp that gives a continuous gradation
of color from high to low elevations or 2) “classified” which gives more informa-
tion and more control. For stretched color ramp, you will use the following
sequence. First, you should right-click the DEMFilename
Properties
Symbology
>
>
stretched, and select the color ramp that you think is appropriate. In addition, you
can create a shaded image called a hillshade to show topographic variation. From
ArcToolBox, you should select 3D Analyst
>
Hillshade and make
sure the unmasked DEM is the selected file in the dialog box. You will then extract
the file using the mask polygon boundary shapefile as before. You will need to
control the sun angle and azimuth for illuminating the digital surface (Fig.
2.21
). In
this example, we used the default values. We suggest you experiment with this
option to determine how it influences the results. This process may take some time
depending on the speed of the computer, so you should be patient. In this example,
the display defaults to a categorical color scheme because the surface is fairly flat,
thus, not very useful. To enhance the hillshade, you can manually change the
hillshade symbology by setting the high value to 255 and low value to zero. This
will create a reasonable hillshade grayscale. To do this, you will right click the
hillshade on the left side of the screen and select properties. In the symbology tab,
Raster Surface
>
>