Environmental Engineering Reference
In-Depth Information
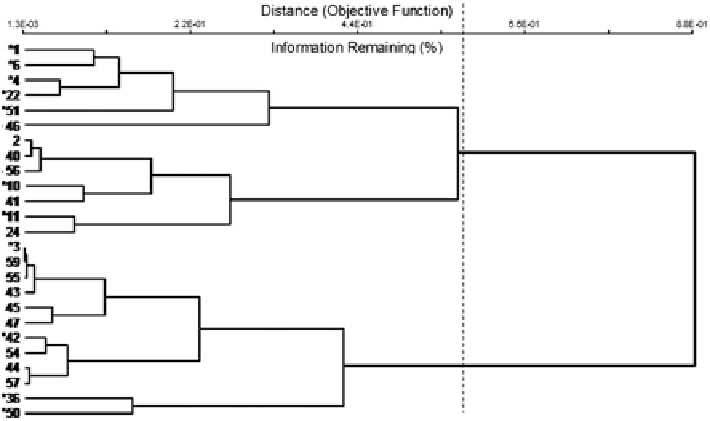
Fig. 5.9 Cluster dendrogram of 25 wetland sites based upon species dissimilarity.
Dashed line
indicates subjective cut-off to create two wetland groups
be useful, because vegetation integrates hydrological, edaphic, and biogeochemical
signals (U.S. EPA
2002
). It also responds more rapidly to anthropogenic and natural
disturbances than hydrogeomorphic setting. On the other hand, this relatively short-
term response to disturbance can be a disadvantage if one is attempting to discern
response to underlying long-term signals, such as global warming or acid rain.
All classification methods attempt to form groups of like communities out of
species data from multiple sites or samples. Early methods relied primarily on
relev´ descriptions and placement into associations based upon species tables
(Barbour et al.
1998
), (see Graf et al. (
2010
) for a recent application). For a
while, TWINSPAN (two-way indicator species analysis) was a popular method of
forming groups identified by indicator species. However, TWINSPAN should never
be used except in simple cases of a single dominant environmental gradient (change
in some environmental variable across sites or time (McCune and Grace
2002
)).
There are multiple methods of distinguishing vegetation groups out of multivariate
data. Multivariate data are collected when workers collect multiple measurements
(species or environmental variables) at a single sampling location (Kenkel
2006
).
Complete coverage of methods and their mathematical rationale is given in
(McCune and Grace
2002
). The most commonly used method in studies of wetland
vegetation is hierarchical cluster analysis. Sites or samples can be placed into
groups based upon their multivariate vegetation using dissimilarity indices (such
as Sorenson or Euclidean distance). It is a hierarchical process, because smaller,
more similar groups are combined into larger, less similar groups, with the smaller
groups becoming sub-groups of the larger groups. The end product is a dendrogram
showing the multivariate similarity between sites or samples (Fig.
5.9
). Groups can