Environmental Engineering Reference
In-Depth Information
a
b
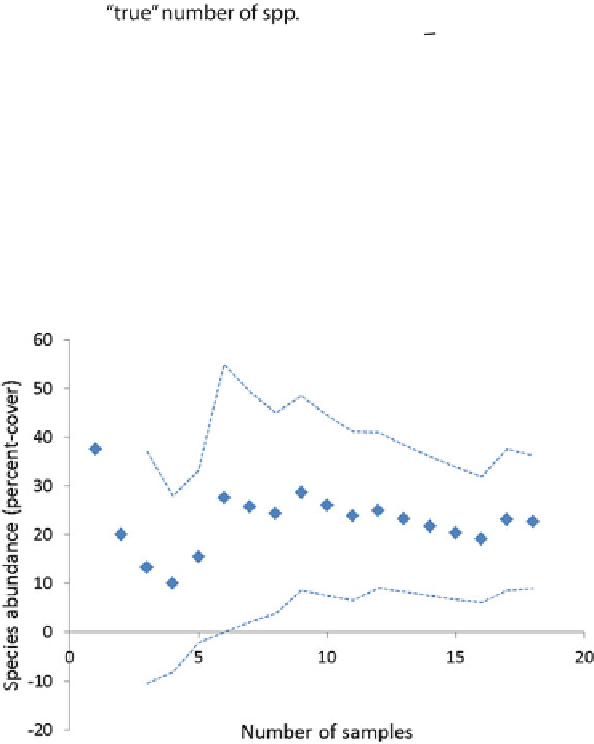
Fig. 5.6 Results from a pilot study.
species.
(b) Performance curve for species-abundance.
Dashed lines
are a 95 % confidence interval
(a) Species accumulation curve, spp.
¼
5.3.6 Tracking Change Over Time
Permanent plots and photopoints are techniques for effectively monitoring vegeta-
tion change over time. If changes are substantial, it is possible to track changes
using random sampling of the same sites at two different times, but maximum
statistical power and confidence that change is real comes from sampling
exactly
the same place at different times. In order to install permanent plots, decisions must
be made about location, plot type, and monumentation. The locations of permanent