Environmental Engineering Reference
In-Depth Information
Field Activity 2: Single-Well Response Test
In Field activity 1, a piezometer was installed either on the margin of or beneath
a wetland bed. Figure
3.43a
demonstrates a piezometer in a wetland with the
screen (slotted portion in the bottom) in direct contact with the sediments, and
panel b demonstrates a piezometer completed in a dry margin of a wetland (the
water table is below the ground surface). The latter has been installed in an
augered hole with a sand pack around the screen and a clay seal above to prevent
“short-circuiting” of water through the annular space. A horizontal line beneath
an inverted triangle is a commonly used symbol to indicate surface-water level.
This symbol is displayed here to indicate the pond water level in (a) and the water
table in (b), as well as the undisturbed water levels (also called static head) in
the piezometers.
A single-well response test, often referred to as a slug test, is initiated by
changing the water level in a water-table well or piezometer very quickly (within
a few seconds) and monitoring the recovery of the water level from the initial
disturbed value to the static level. A number of methods are available for creating
this near-instantaneous water-level change (Butler 1998). The easiest method is to
quickly lower a solid cylinder (typically made of metal or high-density plastic)
attached to a length of rope into the piezometer. This solid “slug” displaces a known
volume of water as it is rapidly lowered into place and the slug remains stationary
for the duration of the test. The water level in the well returns to the static level at a
rate that is controlled by the hydraulic conductivity of the porous medium around
the well screen. After the static level is reached, a second test can be initiated by
rapidly removing the cylinder, thereby causing an instantaneous drop of the water
level. It is always good practice to conduct two response tests (positive and negative
displacement) and check the consistency of results.
c
a
b
1
clay
seal
0.37
sand
pack
L
L
T
b
0.1
2
R
0
1000
2000
3000
4000
5000
2
R
t
(s)
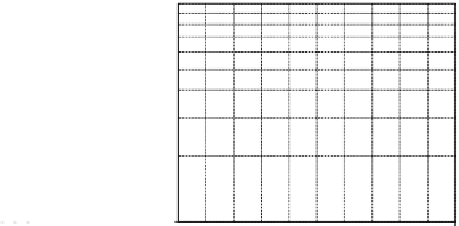
Fig. 3.43 Schematic diagrams of piezometers with screen length
L
and radius
R
without (a) and
with (b) a sand pack; (c) example of the plotted recovery of a single-well response test conducted
in a piezometer located in Wetland 109 in the St. Denis National Wildlife Area