Environmental Engineering Reference
In-Depth Information
10
6
ms
1
,
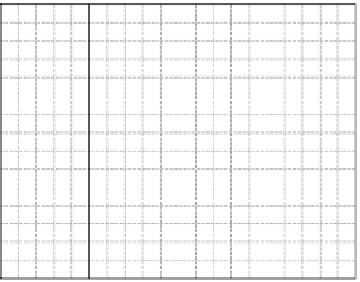
plotting
f
(
q
) against
q
on the graph below. Starting with
q
¼
1
0 is reached, which is
the solution. A positive value of
q
indicates downward flow, and a negative value
upward flow.
8. Calculate the magnitude of
q
using Eq.
3.62
and check the consistency of the
values calculated from Eqs.
3.60
and
3.62
.
keep plotting
f
(
q
) for increasing values of
q
until
f
(
q
)
¼
10000
0
-10000
-20000
0
5
10
15
20
q
(10
-6
m s
-1
)
References
Gordon RP, Lautz LK, Briggs MA, McKenzie JM (2012) Automated calculation of vertical
pore-water flux from field temperature time series using the VFLUX method and computer
program. J Hydrol 420-421:142-158
Keery J, BinleyA, CrookN, Smith JWN (2007) Temporal and spatial variability of groundwater-surface
water fluxes: Development and application of an analytical method using temperature time series.
J Hydrol 336:1-16
Stallman RW (1965) Steady one-dimensional fluid flow in a semi-infinite porous medium with
sinusoidal surface temperature. J Geophys Res 70:2821-2827