Environmental Engineering Reference
In-Depth Information
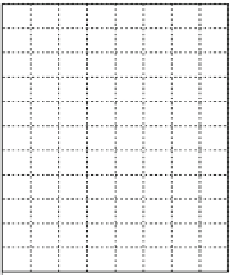
Short Exercise 6: Determination of Stage-Discharge Rating Curve
Coefficients for the stage-discharge rating curve (Eq.
3.26
) of a stream gauging
station can be determined from a series of measurements of stage (
h
) and discharge
(
Q
) encompassing different flow conditions. Table
3.7
lists the measured
h
and
Q
in
a small stream in Calgary, Alberta, Canada. The stage at zero flow (
h
0
) is 0.35 m at
this gauging station. Equation
3.28
can be written in a logarithmic form
log
Q
¼
log
a
þ
m
log
h
ð
h
0
Þ
(3.57)
When the logarithms of data are used to fit a straight line, the intercept and slope of
the line give log
a
and
m
, respectively.
1. Compute log(
h
h
0
) and log
Q
for each measurement.
2. Plot log(
h
h
0
) and log
Q
in the graph and fit a straight line.
3. Determine the intercept and the slope of the plot, and compute
a
and
m
.
Table 3.7 Water stage (
h
) and discharge (
Q
) measured in a small stream near Calgary, Alberta,
Canada in 2011
Date
h
(m)
Q
(m
3
s
1
)
log(
h
h
0
)
log Q
June 9
0.65
0.56
_____
_____
0
June 14
0.59
0.46
_____
_____
June 21
0.88
1.10
_____
_____
-0.2
June 28
0.59
0.45
_____
_____
July 6
0.50
0.27
_____
_____
-0.4
July 13
0.53
0.29
_____
_____
July 26
0.52
0.24
_____
_____
Aug. 8
0.47
0.15
_____
_____
-0.6
Aug. 24
0.44
0.11
_____
_____
-0.8
-1
-1
-0.8
-0.6
-0.4
-0.2
log
(
h
-
h
0
)


