Environmental Engineering Reference
In-Depth Information
3000
2000
2000
1000
1000
S92
S92
0
0
0
0.2
0.4
0.6
0.8
1.2
0
0.2
0.4
0.6
0.8
1.2
1
1
h
(m)
h
(m)
4000
2000
3000
2000
1000
1000
S109
S109
0
0
0
0.2
0.4
0.6
0.8
1
1.2
0
0.2
0.4
0.6
0.8
1
1.2
h
(m)
h
(m)
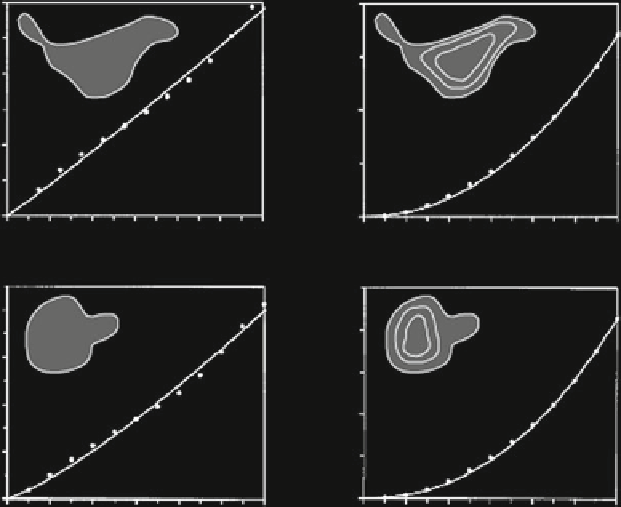
Fig. 3.4 Measured versus modeled areas and volumes of two wetlands in the St. Denis Wildlife
Area, Saskatchewan, Canada. Wetland shape and bathymetry shown in
upper left
portion of plots
(Modified from Hayashi and van der Kamp (
2000
)). Published with kind permission of
©
Elsevier
2000. All Rights Reserved)
Precipitation commonly is measured to the nearest 0.3 mm with an accuracy
generally considered to be
5 to 15 % (Winter
1981
). Daily evaporation commonly
ranges from 0 to 4 mm and rarely exceeds 6 mm. Accuracy of surface-water
measurements depends on the surface-water discharge relative to the wetland
surface area. Even if inputs are relatively large and wetland surface area is rela-
tively small, measurement error expressed in terms of wetland stage usually is less
than 3 mm. Given these magnitudes of daily hydrologic fluxes common to wetland
settings, measuring wetland stage to within 1 mm is not an unreasonable goal, even
though it is rarely achieved with current technology.
3.3.3.1 Staff-Gage Errors
Although accuracy of wetland stage to within 1 mm is desirable, it is quite difficult
to read a staff gage more accurately than about
3 mm. Most staff gages are
incremented no finer than 3 mm and many display 10-mm increments. Observation
errors result from waves that cause the water surface to fluctuate during a gage